Menu
Join Our Email List
- Receive our monthly newsletter.
- Stay up to date on Amazon policies.
- Get tips to grow your business.
/%5BeComEngine%5DLogo-2019-linear.svg "eComEngine Logo")
| Review Monitoring Quickly identify review trends |
| Review Monitoring Quickly identify review trends |


Before you get started, make sure you know the Amazon Brand Registry requirements and have all of the information you need to provide to Amazon.
You'll need to include an active registered trademark or a pending trademark application in each country where you want to enroll. Your trademark should be a text-based mark or an image-based mark with words, numbers, or letters. Trademark text must be included on your products or packaging and the trademark must match the brand name included on your application. If you have an image-based trademark, be sure to upload a copy of the image exactly as it looks on your trademark record. Your Amazon Brand Registry trademark should also appear on your products or packaging. You’ll also need to review all country-specific trademark requirements.
Sign in to Seller Central and enroll in Brand Registry by clicking Enroll now on the eligibility page.
Then you’ll need to provide your brand name which has an active registered trademark that appears on your products or packaging. You’ll also include your brand’s trademark registration number from the Intellectual Property office. You can enroll in Amazon Brand Registry without a trademark if you’re currently waiting for your trademark to be registered with a trademark office. You'll need to provide the application number from the office in your Amazon Brand Registry application.

Provide the list of product categories your brand should be listed in.
After your Brand Registry application is submitted to Amazon, it will verify that you are the Rights Owner for the brand trademark. Amazon will also send a verification code to a contact that meets its requirements. You’ll need to get the code to send back to Amazon to complete your Brand Registry enrollment. After your information has been verified, you’ll have access to Brand Registry features to help protect your brand.

Having a unique and engaging trademark is an important part of the brand development process. Your trademark is your brand’s identity—it distinguishes your brand’s products and gives customers something special to remember to keep them coming back for more. Trademarks identify the source of products and services so you want to ensure your trademark properly represents the look and feel you are going for with your brand.Casey Hewitt
If you’re interested in the Brand Registry but don’t have a registered trademark, Amazon’s IP Accelerator program may be a good option for you. IP Accelerator connects brands with trusted Amazon-vetted IP law firms that offer trademark registration services at competitive, pre-negotiated rates that cover a single brand for a single class of goods or services.
Additional fees will apply for other services, and service fees will apply. For example, a high-level brand search of Trademark Office records for relevant pending applications or registrations will cost you $650. You can receive a comprehensive brand review, including Trademark Office records and unregistered uses, for $1,800. Keep in mind that you may also work with law firms participating in IP Accelerator for other IP-related services like filing design patent or copyright applications.
Trademark registration is a lengthy process that can take months or even years to complete. However, once Amazon sees that a trademark application has been filed, you’ll receive an invitation to the Brand Registry and can begin receiving brand protections. In this way, it’s essentially a fast track to the Brand Registry.
You're probably wondering how much Amazon Brand Registry costs. Good news! It's free to apply. However, you should expect to pay approximately $750 to $1000 for your trademark. The USPTO charges a flat rate of $250 or $350 per class of goods. Trademark attorneys typically charge $500-700 for their services in addition to the filing fee. You can fast-track the application process with participating Amazon IP Accelerator law firms.
Brand owners can see reviews received on their products with the Customer Reviews page on the Brand Dashboard in Seller Central. Customer reviews can help brands identify product defects or listing quality issues. Reviews can also aid brands in detecting and reporting abuse.
Review data is shared here within 24 hours of the review being published on the product detail page. Reviews are retained in the Brand Dashboard for 30 days. You can mark reviews as done by using the check box in the top left corner. This removes the review from the default views on the Customer Reviews page.

Monitoring reviews is critical for brands selling on Amazon. Customers are sharing details about what works and what doesn't for each of your products. You just need to have a process for utilizing that information to continue growing your brand. Requesting more details through the Customer Reviews page is a great way to get more insight into what went wrong when a buyer leaves a negative review.Colleen Quattlebaum
If you find a review that violates Amazon’s customer review policies, you can report abuse right from the product detail page. Click “Report abuse from detail page” under the review in the Brand Dashboard, and then click the “Report abuse” link to send in your report. If the review violates Amazon policies, it will be removed. Note that Amazon takes review abuse very seriously; any brand that has a pattern of improperly reporting reviews as abusive can lose access to the Brand Dashboard.
![]() If you prefer more detailed customer review and rating data, FeedbackFive offers powerful review analytics along with sales trends to help you identify what’s working for your brand.
If you prefer more detailed customer review and rating data, FeedbackFive offers powerful review analytics along with sales trends to help you identify what’s working for your brand.
Brand owners can also use the Contact Customer tool from the Customer Reviews page to respond to critical (1-3 star) customer reviews. The person responding to customers needs to be assigned to the “Brand Representative” role in Brand Registry to access this feature and must be the seller of record for the order associated with the review.
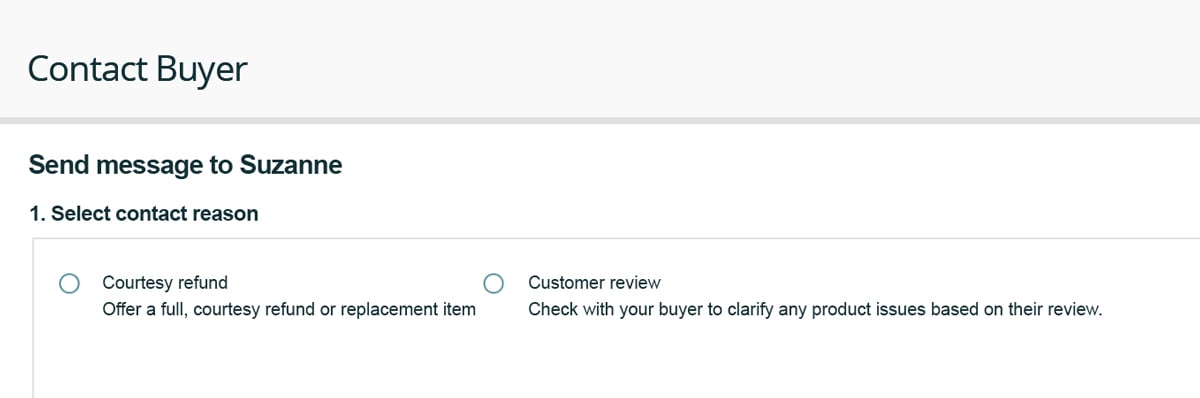
The Contact Customer option will appear on the top right of eligible critical reviews. The brand owner can either offer a full refund or ask the customer for additional details about what went wrong with the order. In both cases, an automated email will be generated and sent via Buyer-Seller Messaging. The brand owner cannot edit this email. Brand owners may contact customers who placed an order and left a negative review in the past six months if they sold the product directly to the customer.


To create your enhanced content, you’ll first need to visit the A+ Content Manager on Amazon. Then, follow Amazon’s instructions for applying A+ Content to your ASINs.
You can publish content to all of your branded ASINs if you so choose (a recently released bulk upload feature makes it much easier!) and have up to 20 pending submissions in review at a time. You may also apply A+ Content to parent or child ASINs (or both) within an ASIN family and also across ASIN families. Your text and images must meet Amazon’s guidelines.


Amazon Brand Registry has evolved into a key to unlock advertising products and tools to enhance your brand and give you a competitive edge. Brands can leverage Sponsored Brands and Sponsored Display ad types to build a full-funnel strategy that drives shoppers from brand awareness to purchase. Brand Registry also gives advertisers the opportunity to improve and differentiate their shopping experiences with Stores and Amazon Live.Ian McGarty
Understanding your customers’ behavior as they interact with your products allows you to operate more strategically in everything from inventory to advertising.
With the Amazon Brand Analytics tool, brand owners are given exclusive access to multiple consumer search and purchase behavior reports that turn aggregated customer information into actionable insights for their business.

Amazon Brand Registry is a no-brainer for any brand owner wanting to maximize their Amazon business. As a brand-registered business, we have been able to participate in new pilot programs, access tools that deliver more in-depth insights about our business, and receive enhanced seller support on the many issues that arise when building a business with Amazon.Laura Lady
The Amazon Brand Analytics Dashboard can be found on the main Brand Dashboard under Brand Benefits. Once there, you’ll see your Amazon Brand Analytics Search Terms report and get access to several reports that give you insight into consumer behavior.

 Brand Registry provides key protections for brands on Amazon. For example, registering your brand gives you more control over your product listing content. This allows you to provide more detailed information for your products while protecting your brand identity.
Brands can decide whether to authorize others to sell their products with Brand Registry. Enrollment in Brand Registry is one of the most important steps a brand can take when it comes to managing unauthorized resellers. By authorizing only your brand or trusted partners to sell your brand’s products, you can better manage brand identity and the resulting customer experience with your brand, as well as MAP pricing. The brand monitoring tools included in the Brand Dashboard also make it easier to discover and manage concerns.

It took us years to craft HelloHealth to provide products and services serving the Neurodiversity Community. We are happy that Amazon Brand Registry has helped HelloHealth protect its brand and its products.Pamela Wirth Barnhill
Registered brands also get access to enhanced Amazon support thanks to a dedicated internal team. Report marketplace violations, including product review manipulation and “not as described” complaints to this team. You can also report listing issues, such as incorrect product details or technical problems related to page loading for your listings, submit IP infringement claims, or escalate claims you’ve previously submitted.
Black hat sellers have been known to register brands under patents and trademarks they don’t own. Registering your brand is critical to prevent issues like this from impacting your business. After the brand is registered under your name, another seller can’t register the brand and make false claims to ownership. Learn about Amazon's APEX program, which offers an innovative approach to patent disputes.
While the rise of third-party sellers and imported goods on the marketplace has continued to grow Amazon’s presence, it has also presented a major problem for brands: counterfeiting. If a cheap knockoff of your best-selling product gets into your customer’s hands, your brand will be the one taking the hit. The fallout to your reputation and sales can be severe.
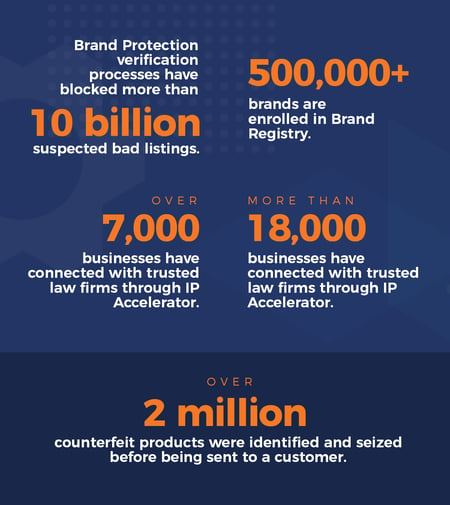
The Amazon Transparency Program was launched as an anti-counterfeiting measure that helps ensure only authentic items are reaching your customers. According to Amazon, more than 47,000 brands are enrolled with Transparency. Here’s what you need to know about the initiative.
 Transparency by Amazon is an item-level authentication service that individually identifies your units and proactively prevents the sale and shipment of counterfeit products to customers. There are four main steps involved:
The Amazon Transparency Program protects you outside of the marketplace, too. You must apply an Amazon Transparency code to the packaging of every Transparency-enabled unit that you manufacture, even if it’s sold off Amazon.
For FBA sellers, Transparency codes will be scanned within Amazon’s fulfillment centers. If you fulfill your orders, Amazon will generate the codes for you, but you must print and place all of the Amazon Transparency labels yourself.
There are currently three eligibility requirements. You must:
If you meet these requirements, visit the Transparency page to get started.
The Amazon Transparency App (available on iOS or Android wherever Transparency is available) is what empowers customers to verify a product’s validity for themselves. Plus, once consumers scan the code (a green checkmark or a red x will let them know if the product has passed), they can also see additional information like the item’s manufacturing date, location, ingredients, and more.
In 2021, Amazon made this experience much more interactive for customers with the addition of the Customer Engagement feature, which allows brands to:
At this time, the Amazon Transparency cost isn’t publicly listed. However, it’s been widely reported that brands can expect to pay anywhere from $0.01 to $0.05 per code based on unit quantity.
Don’t forget that you’ll have to factor in printing and labeling costs, which can eat into your budget if you enroll a high number of units. You may want to start by enrolling the products most vulnerable to counterfeiting first and follow with more later on.
 Fighting Counterfeits: Amazon Project Zero
The ever-growing number of fake products on Amazon has continually forced the marketplace to find new ways to combat the problem. Shortly following the launch of the Transparency program, Amazon Project Zero was introduced as a way for sellers to take more action themselves.
The Amazon Self-Service Counterfeit Removal tool allows brand-registered sellers to remove counterfeit listings themselves. Amazon uses this data to strengthen automated protections to help catch possible counterfeit listings in the future.
This Amazon authenticity program is free to brand registered sellers with a government-registered trademark who have submitted reports of potential infringements with an acceptance rate of at least 90% in the past six months. Project Zero gives sellers automated protections and a self-service counterfeit removal tool. A product serialization service is also available for a price.
The Counterfeit Crimes Unit was launched in 2020. This global team of data analysts, experienced investigators, and former federal prosecutors is dedicated to preventing counterfeit items from being listed on Amazon.
In April 2023, Amazon announced a new feature that makes it easier to view your brand protections across the marketplace.
The recently launched Impact dashboard on the Brand Registry portal provides valuable information on how Amazon safeguards your intellectual property and listings for your brand-registered ASINs. You’ll get insight into:
Additionally, you can view trends and filter protection data by store, brand, or category.


