


Originally published on November 16, 2026, updated November 16, 2026
Menu
Join Our Email List
- Receive our monthly newsletter.
- Stay up to date on Amazon policies.
- Get tips to grow your business.

 |
Review Monitoring Quickly identify review trends |
|
Review Monitoring Quickly identify review trends |

A purchase order placed in January is a bet on spring demand. Between production and ocean freight, the units you order after the holidays usually reach FBA in April or later. Your sales and profit reports show what happened inside your account. They can't show whether buyers will still want the product in April, how many new sellers have entered your niche, or where prices are heading. That takes outside data.
This guide shows how to get that data in a few minutes by asking an AI agent: ChatGPT or Claude, connected to live Amazon marketplace data. It covers four checks to run before you sign the next PO, with real examples and the exact prompts.
Q4 numbers are distorted in ways that make them risky as a baseline for Q1:
Gift demand disappears in January. A product that sold well as a present may sell a fraction of that volume in spring.
Returns pile up after the holidays. Last season, Amazon let customers return most items bought between November 1 and December 31 until January 31. Some of December's sales turn back into inventory.
That's why last year's full curve is a better guide than the last 90 days. December compared with October tells you little. December compared with the previous April tells you a lot.
Getting it wrong costs money in both directions. Order too much, and you risk the aged inventory surcharge, which starts at 181 days in FBA. Seasonal stock that lands in April and waits for October can hit it. Order too little, and you pay the low-inventory-level fee once you drop below 28 days of supply. Amazon now calculates it separately for each variation.
If you already use a reorder point formula for each SKU, market data tells you whether the demand number you plug into it still holds.
ChatGPT and Claude can't see Amazon sales history on their own. Ask them how many units a product sells, and they'll answer from general knowledge, which is how you get confident, wrong numbers.
MCP (Model Context Protocol) solves this. It's an open standard for connecting an AI assistant to an outside data source. With a connector such as AMZScout's Amazon data connector for ChatGPT and Claude, the agent pulls sales history, price history, and listing data for a specific ASIN before it answers.
No code or API setup is needed. You type a question in plain English, the agent fetches the data, and you get a chart or table back. The examples below use real ASINs on Amazon US, with data pulled in October 2026.
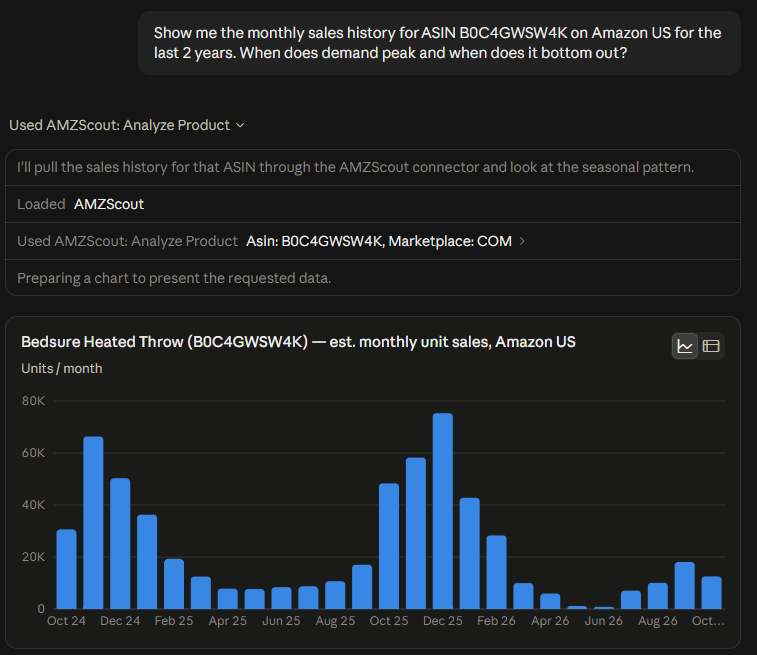
Prompt: Show me the monthly sales history for ASIN [your ASIN] on Amazon US for the last 2 years. When does demand peak, and when does it bottom out?
Here's what the agent returned for a heated throw blanket (B0C4GWSW4K), ranked #1 in Electric Blankets. In the 2024–25 season, estimated sales peaked at about 66,300 units in November 2024 and fell to about 7,800 by April 2025. That's a drop of roughly 88%. The near-zero May and June 2026 on the chart are an anomaly, not seasonality; more on that in the limits section below.
A seller who reorders in January at December's pace gets that stock in April or May, right at the yearly low: ocean freight from Asia alone now averages about 67 days. You don't need to stop selling the product. Size the January order for spring demand and place the large order in summer, ahead of the next peak.
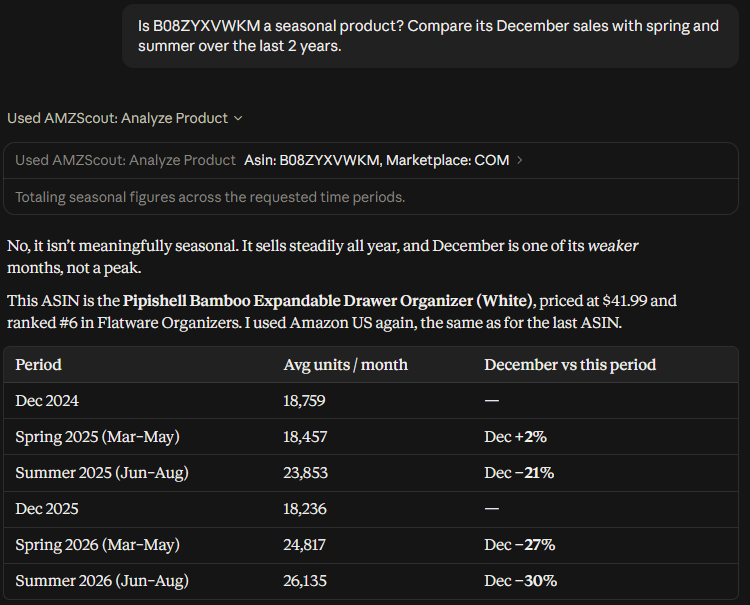
The opposite mistake is just as easy. The same question about a bamboo drawer organizer (B08ZYXVWKM) shows a different curve. In its first year of data, December sales (about 18,800 units) matched the spring average and ran about 20% below summer. A seller who cuts the Q1 order because December came in below November runs short in summer, exactly when demand rises. The second year in the table shows a wider gap, but part of it comes from the product's overall growth, so the first year is the cleaner comparison.
Prompt: Compare [your ASIN], [competitor ASIN], and [competitor ASIN]: launch dates, how fast sales grew, and how prices changed.
Copy the ASINs of listings that started showing up in your search results this year, then ask the agent to compare them with yours.
In the drawer organizer niche, two listings launched in 2025. One reached about 4,500 units in its first full month and has held at around 8,000–11,000 in most months since late 2025. The other sold a few hundred units a month for almost a year, then broke out in 2026 and has sold 3,400–5,600 a month since May.
The organizer from check 1, on the market since 2021, kept growing through both launches, from about 21,000 units a month on average in 2025 to about 26,000 in mid-2026.
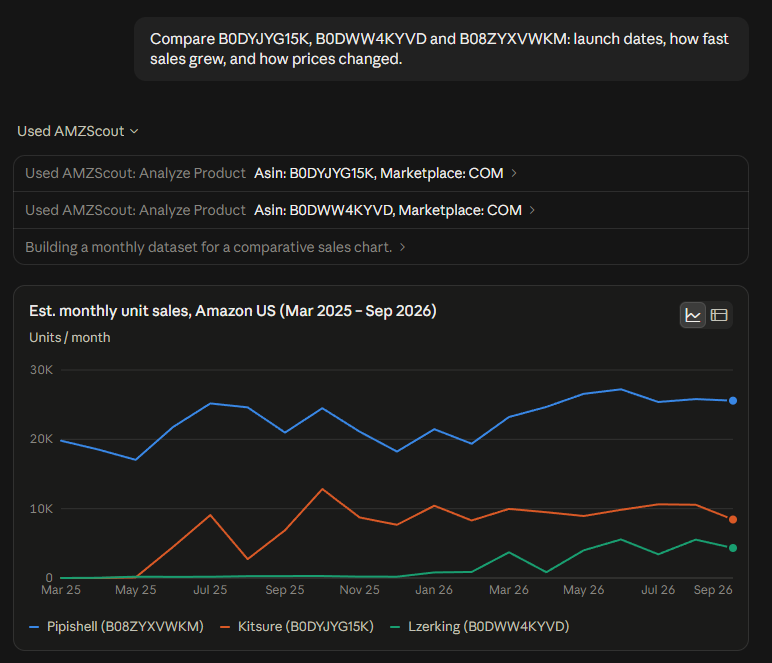
New entrants matter most for your reorder when they grow at your expense. Check whether your curve flattens in the same months theirs climbs. If it doesn't, they're taking share from someone else or growing the niche, and your PO doesn't need a cut.
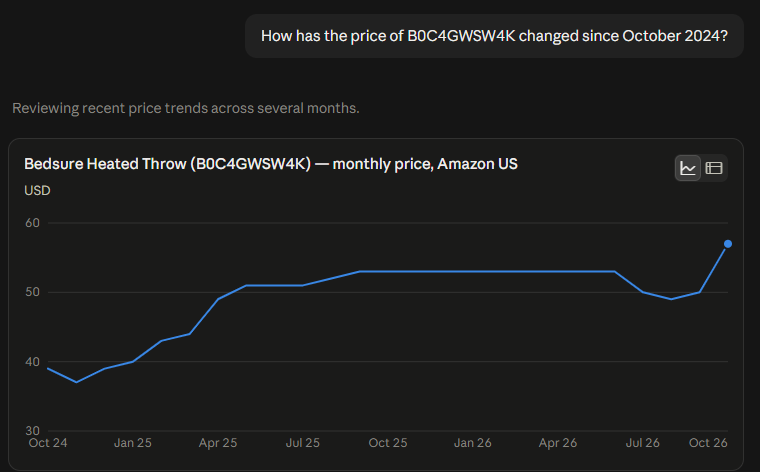
Prompt: How has the price of [your ASIN] changed since [month, year]? Did the price changes affect sales?
Price history shows whether you're reordering into a price war. The heated blanket went from $39 in October 2024 to $53 by September 2025 and held there for nine months. The 2025–26 season still outsold the one before it. In October 2026 the price rose again to about $57; it's too early to see how that affects this season.
In the organizer niche, the data showed a discount that didn't work. The newer listing that launched at $29 cut its price to about $20 in March 2026, and its sales stayed on the same plateau. Meanwhile, the established organizer raised its price by about 40% between October 2024 and October 2026 and kept growing.
If competitors are cutting price and the discounts aren't moving their volume, you probably don't need to follow. SellerPulse protects the margin your reorder is built on. eComEngine's guide to reading SKU economics before you reorder covers the account side of that math.
Prompt: Analyze the [keyword] niche on Amazon US: how concentrated is revenue among the top sellers, and which price range sells the most?
For bamboo drawer organizers, the agent found 16 brands, with the top five holding roughly 60% of revenue. About a third of unit sales fall in the $25–30 range.
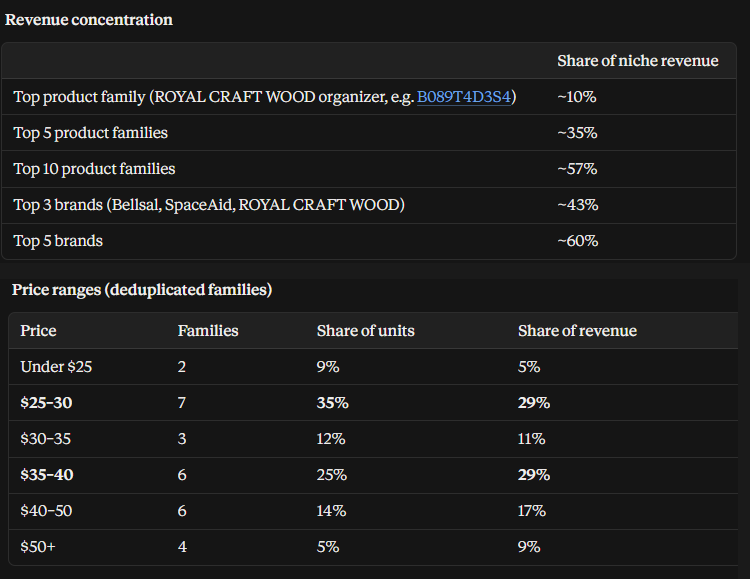
One detail stood out. The agent noticed that many listings repeated the same variation family's sales estimate, grouped them before calculating, and flagged the results as approximate.
For a reorder, this check answers one question: is your price inside the band where most of the volume sits? If it's well above, a bigger order needs a clear reason buyers will pay more. The established organizer sells at about $42, well above the main price band. Its 42,000+ reviews give buyers that reason.
Combine the market view with your own margins. If you've sorted your catalog into scale, fix, watch, and stop groups, use the table below to check each SKU against the market.
If I were reordering the established organizer in January, all four checks would point the same way. Demand is steady with a summer high: December roughly matches spring and runs below summer. New entrants haven't slowed it down. It has raised prices without losing volume, and its review count supports a premium above the niche's main price band. I'd reorder at least last spring's volume, plan extra stock for June through August, and leave the price alone.
For the heated blanket, the seasonality and price checks give a different answer. I'd place a small Q1 order sized to last spring's 8,000–12,000 units a month and plan the main purchase for the summer, so it lands before demand climbs again in the fall.
Marketplace data makes the decision better informed. It doesn't make it for you. Keep these limits in mind:
Sales are estimates. They're modeled from Best Sellers Rank, not taken from the seller's account. Trust the shape of the curve more than the exact number. A quick sanity check: over time, estimated units should be far higher than the listing's review count.
Variation families can blur the numbers. One estimate may cover every color and size. Ask the agent whether a figure is per ASIN or per family.
The current month is partial. Compare full months only.
It shows what happened, not why. When the blanket's 2026 off-season fell far below 2025's, the agent flagged the drop as too steep for seasonality alone and said the data couldn't confirm the cause.
It doesn't know your business. Landed cost, supplier lead time, and cash on hand come from your own systems. An inventory tool like RestockPro covers that side: it forecasts reorder quantities from your own sales and keeps track of purchase orders with your suppliers. The AI agent tells you whether demand will hold, and your restock forecast tells you how much to order and when.
Q4 reports tell you what sold. Before they turn into a Q1 purchase order, take a few minutes to ask what the market will look like when that order arrives. Four questions run against live marketplace data are enough to catch a seasonal trap, a niche filling up with new sellers, or a price war before you pay for the inventory.
About the Author
Valentine Stashik is the COO at AMZScout, where she oversees the company’s operations. AMZScout has built product and keyword research tools for Amazon sellers since 2016, including the Product Database, the PRO AI Extension, used by more than 500,000 people, and a connector that brings live Amazon data into ChatGPT and Claude.






No Comments Yet
Let us know what you think