


.png?width=50&height=50&name=feedbackfive-menu-icon(orange).png "feedbackfive-menu-icon(orange)")
Originally published on October 8, 2026, updated October 8, 2026
Menu
Join Our Email List
- Receive our monthly newsletter.
- Stay up to date on Amazon policies.
- Get tips to grow your business.
/%5BeComEngine%5DLogo-2019-linear.svg "eComEngine Logo")
 |
Review Monitoring Quickly identify review trends |
|
Review Monitoring Quickly identify review trends |

Prime Big Deal Days is over.
The dashboards have stopped flickering quite so dramatically. Orders have slowed to something resembling normal. And somewhere, someone on your team has probably already said:
“That was a great event.”
Maybe.
But before we break out the metaphorical champagne—or the very real coffee—you need to answer a more important question:
Did all those extra sales actually make you more money?
That’s where your Prime Big Deal Days profit analysis begins.
Because revenue is exciting. Units sold look great in a Slack message. And watching your sales graph shoot upward is undeniably satisfying.
But sales are not profit.
Discounts, FBA fees, deal fees, advertising costs, returns, and product costs were all invited to the party, too.
And they have a habit of hanging around after everyone else leaves.
Amazon’s 2026 Prime Big Deal Days ran October 6–7, giving Prime members 48 hours of deals across more than 35 categories.
For sellers, the next 48 hours should be about something entirely different:
figuring out what actually happened to profitability.
This is not the time for an exhaustive quarterly review.
You’re looking for the early signals.
That’s the real post-event scoreboard.
Imagine two products.
Which SKU won Prime Big Deal Days?
If you're looking only at revenue, probably SKU A.
If you're running a business, SKU B has a much better argument.
That distinction is exactly why your post-event review needs to move beyond the Seller Central sales total.
Post-Event Checkpoint:
Don’t ask, “How much did we sell?”
Ask, “How much did we keep?”
Event-driven promotions and Lightning Deals can push unit velocity 3–10x normal levels for some products.
Wonderful.
Also: dangerous.
Not because selling more is bad. We remain firmly pro-selling-things.
The problem is that when everything accelerates at once, small profitability problems get buried beneath impressive-looking numbers.
A $1.50 margin leak on an ordinary Tuesday may be annoying.
Multiply it across several thousand heavily promoted units over a major Amazon event, and suddenly Tuesday’s annoyance has rented office space.
The first obvious culprit is your promotional price.
A 15%, 20%, or 30% discount might dramatically improve conversion and velocity—but every additional unit starts with less revenue available to absorb:
A promotion can absolutely generate more total profit with a lower margin.
But that outcome isn't automatic.
You have to do the math.
Promotional fees are especially easy to mentally file under “cost of doing Prime Day.”
That doesn't mean you should ignore them.
Amazon's published 2026 fee structure for peak events including Prime Big Deal Days includes an upfront fee of $100 per promotion plus 1.5% of sales generated by the deal, with the variable portion capped at $5,000.
That needs to make its way into your profitability analysis.
Especially if you ran multiple promotions.
A deal that produced a pile of revenue may still have been a smart investment.
But “it sold a lot” isn't the calculation.
Incremental profit generated – promotional costs = a much more useful answer.
And even that is only part of the picture.
You don't need a 43-tab spreadsheet and a ceremonial finance meeting.
Start with five things.
Go product by product.
Which SKUs actually produced the most profit during the event?
Not sales.
Not orders.
Profit.
This is where the results can get interesting.
Your highest-revenue SKU doesn't necessarily have to be your highest-profit SKU. A lower-volume item with stronger margins and efficient advertising may have contributed significantly more money to the business.
That's a distinction worth knowing before Q4 ramps up even further.
Next, compare margin during Prime Big Deal Days against your normal baseline.
Look for products where:
A temporary margin reduction isn't automatically a problem.
Maybe acquiring customers, gaining visibility, moving excess stock, or building sales velocity justified it.
But the tradeoff should be intentional.
If you sacrificed margin without realizing it, that's not strategy.
That's just a surprise invoice from your own promotion.
Big shopping events can make Amazon advertising dashboards look like they consumed an energy drink.
Search volume rises.
Competition rises.
Clicks rise.
CPCs may move.
Budgets disappear faster.
And because organic sales are also surging, it can become harder to see whether your advertising actually became more efficient.
Review:
A campaign that produced twice the revenue while costing three times as much deserves a closer look.
A campaign that efficiently helped introduce shoppers to a highly profitable SKU?
That's something you may want to replicate.
This is where many sellers discover that the gross-sales celebration may have started a little early.
Review your fees at the product level.
SellerPulse, for example, can break down FBA fees by ASIN and fee type so you can identify where costs are putting pressure on margin instead of staring at one giant Amazon-expenses number.
You're looking for outliers.
Did one product carry unexpectedly high costs?
Did fulfillment expenses behave differently than expected?
Did promotional volume amplify an existing margin problem?
More volume doesn't fix bad unit economics.
It just makes them happen faster.
Here's the mildly inconvenient part.
Your true Prime Big Deal Days profit isn't completely knowable 48 hours after the event.
Returns haven't fully arrived yet.
That doesn't mean you should wait weeks to analyze anything.
Run the first review now, then revisit the numbers once return activity has matured.
If a product generates fantastic event sales but historically produces a high return rate, build that expectation into how you interpret early results.
A sale isn't quite a victory until enough of the money stays home.
One of the easiest mistakes to make after a major Amazon event is reviewing the account only at the store level.
Total sales: up.
Total profit: up.
Everyone goes home happy.
Except individual SKU performance may tell a completely different story.
One product might have generated exceptional incremental profit.
Another could have sold three times its normal volume while margin collapsed.
Another might have depleted inventory you desperately need heading into Black Friday and Cyber Monday.
And another might have quietly become your unexpected event MVP.
That's why SKU-level analysis matters.
For each major event seller, answer:
Put those together and you're no longer looking at an event recap.
You're building better Q4 decisions.
Amazon already gives sellers a lot of data.
The challenge isn't finding another number.
It's figuring out which numbers deserve your attention.
SellerPulse brings SKU-level economics into one clearer view so you can evaluate products based on what they're actually contributing to the business.
Its SKU Economics reporting includes sales, product costs, refunds, FBA fees, ad spend, profits, and margin information, while its fee reporting lets sellers investigate costs by product and fee type.
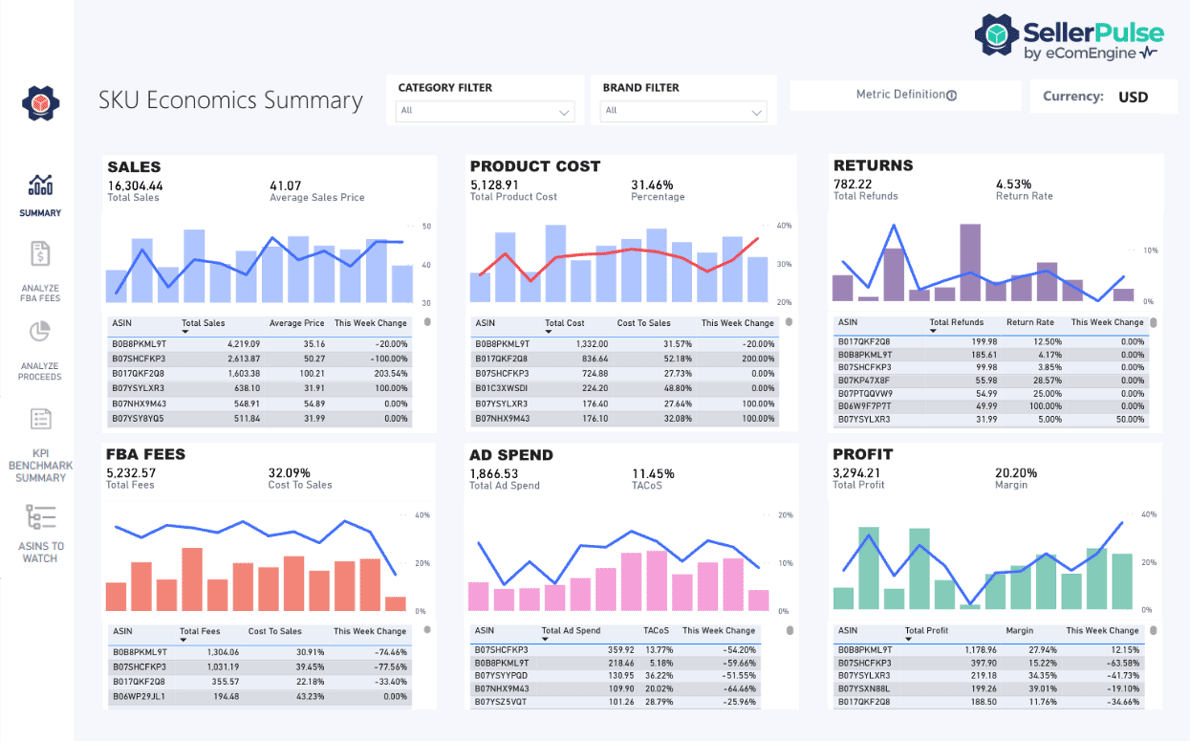
That makes it especially useful after a high-volume event.
Instead of seeing:
“Sales were up 327%! 🎉”
You can start asking:
“Great. Which products actually became more profitable?”
SellerPulse can help you:
Because your best-selling product isn't always your best product.
And Prime Big Deal Days has a wonderful way of making that very obvious.
Run Your Post-Event Profit Check
Prime Big Deal Days gave you the sales spike.
Now find out what those sales were actually worth.
Use SellerPulse to dig into SKU-level profitability, advertising costs, fees, returns, and margin performance before you make your next Q4 move.
RUN YOUR POST-EVENT PROFIT CHECKThe most valuable part of your Prime Big Deal Days analysis isn't deciding whether October 6–7 was “good.”
It's deciding what you do next.
Your post-event numbers should influence the rest of Q4.
If a SKU maintained healthy margins while scaling volume, pay attention.
That may influence:
You've just received a two-day stress test of real customer demand.
Use it.
High velocity can camouflage weak economics.
If an item needed a heavy discount and aggressive ad spend just to generate modest profit, decide whether the promotional strategy still makes sense.
Maybe the price changes.
Maybe the ad strategy changes.
Maybe you reduce the discount.
Maybe the SKU shouldn't be promoted at all.
All are better answers than:
“But we sold a ton of them.”
There's another cruel little twist to successful fall events:
Sometimes you win so hard that you create an inventory problem.
If Prime Big Deal Days significantly accelerated sales velocity, your previous inventory assumptions may already be outdated.
A SKU that looked comfortably stocked a week ago could suddenly be headed toward trouble.
That matters when you're entering the busiest part of Q4.
Revisit:
SellerPulse includes inventory KPIs such as Days of Supply, Sell-Through Rate, and aged inventory metrics that can help sellers evaluate how efficiently inventory is moving.
Yesterday's sales win shouldn't become November's stockout.
Revenue is the number everybody sees first.
Profit is the number that deserves the follow-up.
So before you label Prime Big Deal Days 2026 a smashing success, give your numbers another look.
Then use what happened during these 48 hours to improve the next 80-plus days.
Because the point of a big Amazon event isn't to win Prime Big Deal Days.
It's to build a more profitable business after it's over.
Q1: How do I know if Prime Big Deal Days was actually profitable for my Amazon business?
Compare total sales with your complete event-related costs, including product costs, discounts, FBA fees, promotional fees, advertising spend, and expected returns. Reviewing profitability at the SKU level provides a clearer picture than looking at total revenue alone.
Q2: What should Amazon sellers review after Prime Big Deal Days?
Start by reviewing net profit, profit margin, unit sales, advertising spend, TACoS, Amazon fees, inventory levels, and early return activity. Compare event performance with your normal baseline to identify meaningful changes.
Q3: How soon should I analyze Prime Big Deal Days results?
Run an initial profitability review within approximately 48 hours after the event. This allows you to identify major changes in sales, advertising costs, margins, fees, and inventory quickly. Revisit the analysis later after more returns have been processed.
Q4: Can higher Amazon sales result in lower profit margins?
Yes. Higher unit volume does not automatically mean stronger profitability. Discounts, higher advertising costs, Amazon fees, deal fees, product costs, and returns can reduce margin even when revenue increases significantly.
Q5: Should I evaluate Prime Big Deal Days performance by SKU?
Yes. SKU-level analysis can reveal which products generated profitable growth and which products produced high sales but weak margins. Store-level totals can hide significant differences between individual products.
Q6: How can SellerPulse help with a post-Prime Day profit analysis?
SellerPulse provides SKU-level profitability insights and reporting for factors including sales, product costs, refunds, FBA fees, advertising spend, profits, and margins. It can help sellers identify which products are performing efficiently and where margin pressure may be developing.
Q7: What should I do with my Prime Big Deal Days data before Black Friday and Cyber Monday?
Use your event results to adjust promotional pricing, advertising budgets, inventory plans, reorder decisions, and SKU priorities. Products that generated efficient profit may warrant additional investment, while high-volume products with weak margins should be reviewed before your next promotion.
Ready to Find Out What Prime Big Deal Days Was Really Worth?
The orders are in.
The sales graph had its moment.
Now let's get to the number that actually matters.
Your profit.
Use SellerPulse to see which SKUs made money, where margins slipped, how fees and advertising affected performance, and where you should focus next.
RUN YOUR POST-EVENT PROFIT CHECK30-Day Free Trial • Credit Card Required • Cancel Anytime





No Comments Yet
Let us know what you think