


.png?width=50&height=50&name=feedbackfive-menu-icon(orange).png "feedbackfive-menu-icon(orange)")

Originally published on October 9, 2026, updated October 9, 2026
Menu
Join Our Email List
- Receive our monthly newsletter.
- Stay up to date on Amazon policies.
- Get tips to grow your business.
/%5BeComEngine%5DLogo-2019-linear.svg "eComEngine Logo")
 |
Review Monitoring Quickly identify review trends |
|
Review Monitoring Quickly identify review trends |

Fall Prime Day is over.
The orders came in. Units moved. Revenue climbed. Hopefully, there were a few celebratory refreshes of the sales dashboard along the way.
Now comes the less glamorous question:
How much of that money did you actually keep?
Because while a sales spike looks great on a dashboard, increased volume can also make it surprisingly easy for Amazon FBA fees to disappear into the background.
A few extra cents here.
A storage charge there.
An inbound fee you weren't expecting.
A return rate that quietly got more expensive.
Suddenly the SKU that looked like a Q4 hero is working suspiciously hard just to make Amazon money.
And October is exactly when you want to figure that out.
Peak-season inventory is starting to move into Amazon's network. Holiday advertising is about to get more competitive. Order volume is heading up. And any fee problem that looks small at today's volume can become significantly more expensive once Q4 hits full speed.
So before you send another big shipment or crank up the holiday ad budget, it is time for a fee audit.
AUDIT YOUR FEES NOWOne of the dangerous things about a high-volume selling event is that nearly everything gets bigger at once.
And because the top-line numbers are moving so quickly, a shrinking margin can be surprisingly easy to miss.
Imagine a SKU normally sells 500 units per month.
During a major promotional period, it sells 2,000.
If your true cost per unit is off by only $0.75, that difference suddenly represents $1,500 in margin you did not account for.
Now multiply that across a catalog.
Then multiply it across November and December.
Congratulations. Your tiny spreadsheet rounding error has acquired a holiday shopping habit.
This is why your post-event analysis should not stop at:
How much did we sell?
The much better question is:
What did each sale actually cost us?
When sellers think about Amazon fees, they often start with the obvious ones:
Those certainly matter.
But they are only part of the picture.
Depending on your products, inventory practices, fulfillment strategy, optional programs, and account activity, sellers can encounter 40+ different fee and charge types across the Amazon ecosystem.
If you routinely monitor only five or ten of them, your profitability calculation may be missing costs that never make it into the spreadsheet.
Individually, some of those charges may look harmless.
Collectively?
That is where things get interesting.
Or depressing.
Depends how much coffee you've had.
You do not need to become an Amazon fee archaeologist and catalog every charge that has ever existed.
You do need to understand which fees are materially affecting your SKUs.
Start with these categories.
Fulfillment fees are one of the most obvious Amazon FBA costs — which also makes them one of the easiest to assume you already understand.
That assumption can get expensive.
Your fulfillment cost is influenced by factors including product dimensions, shipping weight, and size tier. Changes to packaging, catalog data, or product measurements can therefore change your economics without your selling price moving a penny.
Amazon also introduced a 3.5% fuel and logistics-related surcharge on FBA fulfillment fees beginning April 17, 2026.
So if your margin model is still based on an older fulfillment-cost assumption, now is a very good time to update it.
Audit question: Are the fulfillment fees you are actually paying consistent with the assumptions in your current SKU-level profitability model?
Here is where the October timing gets particularly important.
Amazon's 2026 holiday peak fulfillment fees are scheduled to apply from October 15, 2026 through January 14, 2027, and Amazon says its fuel and logistics surcharge applies to those rates as well.
In other words, the economics you saw during early October are not necessarily the economics you will see during peak season.
That makes this week a useful dividing line.
Before you commit heavily to Q4 inventory, promotions, and advertising, calculate what happens to margin under the peak fee structure.
A SKU that is nicely profitable today may look considerably less impressive once holiday fulfillment costs, advertising pressure, and promotional discounts pile on.
Audit question: Does this SKU still meet your margin target after peak fulfillment costs are included?
Getting inventory into Amazon has become its own profitability equation.
FBA inbound placement fees can vary based on factors including product size, shipping weight, region, and the number of inbound locations in your shipping plan.
Amazon increased inbound placement fees for some products in 2026, including an average $0.05-per-unit increase for standard-size products under certain shipment configurations.
Five cents does not exactly sound like a financial emergency.
Until you ship 20,000 units.
Then it is $1,000.
This is a recurring theme with Amazon fees:
Tiny per-unit numbers become surprisingly large numbers when volume shows up.
Audit question: What is your actual inbound cost per unit, and is that cost included in your reorder and purchasing decisions?
Inventory sitting inside Amazon's fulfillment network is not free.
And inventory sitting there for a long time can become considerably less charming.
Amazon charges monthly inventory storage fees, while aged inventory can trigger additional surcharges as inventory remains in fulfillment centers. Amazon identifies aged inventory surcharges as one of the core FBA costs sellers should monitor.
This matters even more heading into Q4 because overbuying often looks reasonable in October.
Demand is coming.
Holiday sales will take care of it.
What could possibly go wrong?
Well...
Demand forecasts miss.
Some SKUs outperform.
Others sit there like they have signed a twelve-month lease.
And suddenly inventory purchased to avoid a December stockout is still hanging around months later, tying up cash and accumulating costs.
Audit question: Which SKUs are generating enough profit to justify the cash and storage capacity they consume?
Returns are easy to treat as a customer-service metric.
They are also a profitability metric.
Amazon's returns processing fee can apply to products outside apparel and shoes when return rates exceed category-specific thresholds. The fee is assessed on returned units above those thresholds and varies based on size tier and shipping weight.
A high-revenue SKU with an unusually high return rate can therefore become much less attractive once you account for:
That is why return rates should never live in a completely separate universe from your profitability reporting.
Audit question: Are high-return products also some of your weakest-margin products?
Sometimes the cheapest inventory to own is inventory you stop owning.
Slow-moving, aging, or unprofitable inventory can continue consuming cash and generating fees long after its original business case disappeared.
Amazon charges per-unit fees when sellers request inventory removal or disposal.
Those costs matter.
But they should be compared against the cost of doing nothing.
Keeping weak inventory indefinitely because you do not want to pay a removal fee is a bit like refusing to cancel a gym membership because you already bought the workout clothes.
The money is still leaving.
Audit question: Are you keeping any inventory purely because taking action feels more painful than continuing to pay for it?
A fee showing up on your account is not automatically bad.
Amazon provides fulfillment, storage, distribution, customer service, returns processing, and an enormous marketplace.
Those services have costs.
The problem begins when your operating decisions are based on an incomplete version of those costs.
Consider two products.
Which one deserves more Q4 inventory?
If you are looking primarily at revenue, SKU A might win.
If you are looking at the economics behind the revenue, the answer could be very different.
That distinction matters enormously during Q4 because your inventory budget is finite.
Every dollar committed to a weak SKU is a dollar that cannot be committed somewhere else.
Your total Amazon fees increased 22%.
Is that good?
Bad?
Concerning?
Completely normal?
Without additional context, you have no idea.
This is why fee analysis becomes much more useful when you move from:
"How much did Amazon charge us?"
to:
"What fees are affecting each product, and what is happening over time?"
That is where SKU-level analysis earns its keep.
You do not need a 47-tab spreadsheet called FINAL-FINAL-Q4-PROFIT-v9.xlsx.
You need a repeatable process.
Start with the products that produced the most unit volume during Fall Prime Day.
High volume magnifies small fee problems.
If something is wrong, these SKUs are likely where correcting it will produce the biggest financial impact.
Do not just look at total fees.
Look for changes.
Trends tend to reveal problems faster than isolated numbers.
For each priority SKU, account for the major costs affecting profitability, including:
The point is not to create the world's prettiest financial model.
The point is to answer:
When this product sells, how much money are we actually keeping?
Look for products with:
These are your suspects.
No tiny detective hat required.
Once you understand what is driving the problem, your options may include:
Sometimes the answer is growth.
Sometimes the answer is optimization.
And occasionally the answer is:
Why are we still selling this thing?
That is a perfectly valid answer too.
Amazon gives sellers plenty of data.
The hard part is turning all of those numbers into decisions.
SellerPulse helps you see profitability at the SKU level and connect the factors affecting margin — including Amazon fees, returns, advertising spend, and product costs.
Its SKU Economics reporting includes sales, product costs, returns, FBA fees, ad spend, and profit data. You can also analyze FBA fees by fee type, product, and week, making it much easier to see exactly where margin pressure is coming from.
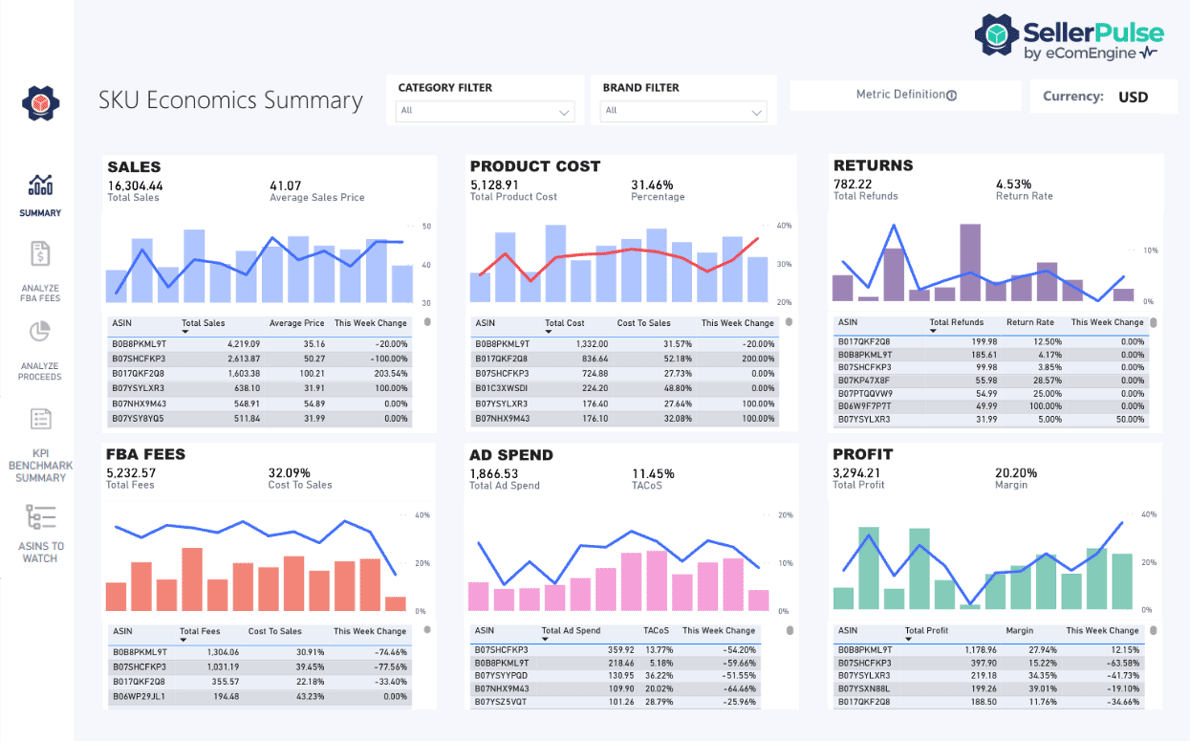
Instead of knowing only that your Amazon fees went up, you can investigate:
SellerPulse provides a 12-week view of FBA fees by fee type and individual ASIN, helping sellers identify products where fee pressure may be building.
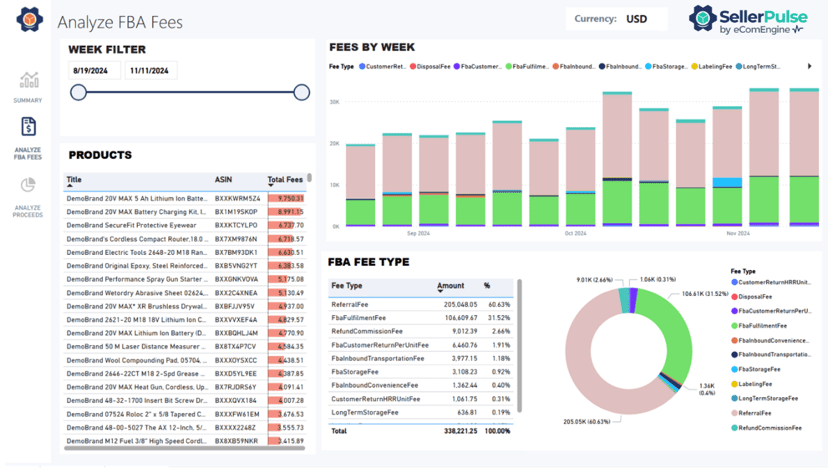
That is particularly useful heading into Q4.
Because when order volume accelerates, you do not want to discover a profitability problem after thousands more units have shipped.
You want to catch it while you still have time to do something about it.
AUDIT YOUR FEES NOWFall Prime Day gave you fresh data.
Peak season is about to give you a lot more volume.
The smartest move right now is to use one to prepare for the other.
Look beyond revenue.
Look beyond units sold.
Look beyond the handful of Amazon fees you have always watched.
Find the charges that are quietly changing your product economics.
Then determine which SKUs actually deserve more inventory, more advertising, and more Q4 attention.
Because the goal this holiday season is not to generate the biggest sales number possible.
It is to make sure enough of that number survives the trip to your bank account.
And preferably without being nibbled to death by seventeen different fees on the way there.
Q: What Amazon FBA fees should sellers monitor?
Amazon sellers should monitor fulfillment fees, referral fees, storage fees, inbound placement fees, aged inventory surcharges, returns processing fees, removal and disposal fees, and other charges that apply to their products and fulfillment strategy. Sellers should evaluate fees at the SKU level because the impact can vary significantly between products.
Q: Why should Amazon sellers audit their fees before Q4?
Sellers should audit Amazon fees before Q4 because higher holiday sales volume can magnify small per-unit cost problems. Identifying unexpected fees or shrinking SKU margins before peak season gives sellers more time to adjust pricing, inventory, advertising, packaging, or replenishment decisions.
Q: When do Amazon's 2026 holiday peak fulfillment fees begin?
Amazon's 2026 holiday peak fulfillment fees are scheduled to apply from October 15, 2026 through January 14, 2027. Amazon's 3.5% fuel and logistics-related surcharge also applies to applicable peak fulfillment rates.
Q: How can Amazon fees reduce profit even when sales are growing?
Amazon fees can reduce profitability when fulfillment, storage, inbound, returns, advertising, or other costs increase faster than revenue. A product can therefore generate more sales while producing a lower profit margin. Reviewing SKU-level economics helps sellers identify when higher revenue is not translating into higher profit.
Q: How often should Amazon sellers review FBA fees?
Amazon sellers should review FBA fees regularly rather than waiting for a monthly or quarterly financial review. Weekly fee and profitability monitoring can make it easier to identify unusual cost increases before they become expensive patterns, particularly during high-volume periods such as Prime Day and Q4.
Q: How can I identify which Amazon fees are hurting a specific SKU?
Analyze fees by individual ASIN and fee type, then compare those costs over time. Look for changes in fulfillment costs, storage, returns, inbound expenses, advertising, and other charges alongside changes in sales and margin. SellerPulse provides FBA fee reporting by product, fee type, and week to simplify this analysis.
Q: Can SellerPulse help me analyze Amazon FBA fees?
Yes. SellerPulse helps Amazon sellers analyze FBA fees by product, fee type, and week and connect those costs with SKU-level profitability data. Sellers can use these insights to identify products experiencing increased fee pressure and determine where corrective action may be needed.
Your Q4 Sales Are About to Get Bigger. Make Sure Your Profit Does Too.
More volume can amplify a great product.
It can also amplify a bad margin.
Use SellerPulse to see which Amazon fees are affecting your SKUs, identify the products quietly losing profitability, and make smarter decisions before peak-season volume turns small problems into expensive ones.
AUDIT YOUR FEES NOW







No Comments Yet
Let us know what you think