


.png?width=50&height=50&name=feedbackfive-menu-icon(orange).png "feedbackfive-menu-icon(orange)")

Originally published on September 11, 2026, updated September 11, 2026
Menu
Join Our Email List
- Receive our monthly newsletter.
- Stay up to date on Amazon policies.
- Get tips to grow your business.
/%5BeComEngine%5DLogo-2019-linear.svg "eComEngine Logo")
 |
Review Monitoring Quickly identify review trends |
|
Review Monitoring Quickly identify review trends |

Amazon changed its fees again.
We know. Shocking.
Somewhere, an Amazon seller just whispered, “Surely not,” while instinctively opening a spreadsheet with 37 tabs and a filename ending in FINAL_v8_REALFINAL.xlsx.
But 2026 has given sellers another important reminder: the margin you calculated six months ago may not be the margin you have today.
Amazon entered 2026 with adjustments to its Fulfillment by Amazon fee structure. Then, in April, another cost showed up: a 3.5% fuel and logistics-related surcharge on FBA fulfillment fees.
And now Q4 is approaching, bringing the annual jump in Amazon storage costs with it.
Individually, none of those changes necessarily looks catastrophic.
Eight cents here.
Seventeen cents there.
A few more dollars in storage.
Multiply them across thousands—or hundreds of thousands—of units, though, and suddenly “just a few cents” has a surprisingly expensive personality.
So before you lock in Q4 prices, reorder your holiday winners, or assume a SKU is still producing the margin it did earlier this year, it is time to run the numbers again.
Not revenue.
Not sales velocity.
Actual profit.
Let’s start with the running tally.
Amazon announced that its 2026 U.S. FBA fee changes would increase fees by approximately $0.08 per unit sold on average, which Amazon described as less than 0.5% of the selling price of an average item.
Most changes took effect January 15, 2026.
Eight cents.
Not exactly the number that makes you dramatically flip your desk.
But that’s also why these changes are easy to underestimate.
If you sell 20,000 units per month, an average eight-cent increase represents:
Over a year, that’s $19,200.
And that was before April arrived.
Amazon subsequently announced a 3.5% fuel and logistics-related surcharge, effective April 17, 2026, for FBA fulfillment fees in the U.S. and Canada.
Here’s the important part:
The surcharge is 3.5% of your FBA fulfillment fee, not 3.5% of your product’s selling price.
Amazon estimates that the surcharge adds approximately $0.17 per unit on average for U.S. FBA sellers, although the actual amount depends on the item’s applicable fulfillment fee, including factors such as size and dimensions.
Again:
Seventeen cents.
Seems tiny.
At 20,000 units per month?
Now combine Amazon’s two published averages:
At 20,000 units a month, that’s roughly:
That $0.25 figure is only an illustration using Amazon’s separate averages. It is not a universal fee increase for every SKU.
But that’s exactly the point.
You shouldn’t manage Amazon profitability using averages. You should manage it SKU by SKU.
If your inventory lives in FBA, fulfillment isn’t the only number to revisit.
Storage changes dramatically when the calendar hits October.
For non-dangerous goods under Amazon’s current 2026 U.S. fee structure, standard-size inventory is generally charged $0.78 per cubic foot from January through September and $2.40 per cubic foot from October through December.
For oversize inventory, the corresponding base rate moves from approximately $0.56 to $1.40 per cubic foot.
In other words, the standard-size base storage rate during Q4 is more than three times the January-through-September rate.
That seasonal increase isn’t a surprise fee Amazon invented yesterday. But it becomes a much bigger part of the margin equation when you’re simultaneously dealing with higher fulfillment costs, a fuel surcharge, larger Q4 inventory positions, and SKUs that don’t sell through as quickly as planned.
And storage isn’t always just the base rate.
Depending on your inventory levels, age, and utilization, additional storage-related surcharges may apply.
So the question heading into Q4 isn’t simply:
“How much inventory should I buy?”
It’s also:
“How much margin will be left if that inventory sits longer than I expect?”
That’s a considerably less fun question.
It is also the one that pays the bills.
Amazon operates at enormous scale.
So do many successful Amazon sellers.
That means small changes become large numbers remarkably quickly.
Consider two SKUs.
If you’re looking only at sales, SKU A wins by a landslide.
Cue confetti.
If you’re looking at what is actually left after product cost, Amazon fees, advertising, refunds, returns, and other expenses, SKU B may be producing the healthier business.
That distinction matters even more after a fee change.
A 17-cent increase barely registers on a SKU with $12 of per-unit profit.
On a product earning $0.90?
Congratulations. Amazon just invited itself to a considerably larger percentage of dinner.
Many sellers know their selling price.
They know their product cost.
They probably know their referral fee.
Then things get… approximate.
Advertising gets averaged.
Returns get ignored until they hurt.
Storage gets treated like an overhead line item.
New Amazon fees get added “later.”
And somewhere in there, a product gets labeled a 22% margin SKU based on math that hasn’t been updated since Prime Day.
That is dangerous heading into Q4.
Your profitability calculation needs to reflect what the SKU costs now.
At a basic level:
The trick is that “all” is doing a tremendous amount of work in that sentence.
For an FBA SKU, your calculation should consider costs such as:
Your actual landed product cost, not what the factory charged you three purchase orders ago. If supplier pricing, tariffs, freight, packaging, or manufacturing costs changed, update them.
Calculate the appropriate referral fee based on the product’s current category and selling price.
Use the SKU’s current fulfillment fee rather than an old spreadsheet assumption.
Remember that this is applied to the fulfillment fee, not your entire sales price. For example, if a hypothetical SKU carries a $5.00 FBA fulfillment fee:
That’s roughly another 18 cents per fulfilled unit. Sell 50,000 of those units? That hypothetical surcharge alone would represent approximately $8,750. Small percentage. Large multiplication table.
Estimate storage based on:
And if you’re modeling Q4, use Q4 economics. Using an off-peak storage assumption for inventory you expect to hold in November is basically letting Past You prepare a financial prank for Future You.
Calculate ad spend at the SKU level whenever possible. Revenue generated through significant Sponsored Products investment is not economically identical to revenue generated organically. A product can have fantastic sales and deeply mediocre economics.
Returns are especially important for categories where rates vary significantly among ASINs. A SKU with a 4% return rate and a SKU with a 17% return rate are not the same business simply because both generated $100,000 in sales.
Depending on your operation, consider:
Once those numbers are accounted for:
That’s the number that should influence your pricing, advertising, purchasing, and replenishment decisions.
Not the margin you remember having.
Not the margin your spreadsheet predicted in January.
The margin the SKU is producing now.
Q4 creates a particularly nasty combination of higher stakes and less room for error.
You may be:
That means your selling price can stay exactly the same while your actual margin quietly gets worse.
And once you’ve committed to a large purchase order or promotional strategy, fixing that mistake becomes significantly harder.
For every meaningful SKU, ask:
Use current fees and costs.
Factor in promotions and discounting before committing to them.
Model storage, not just fulfillment.
Because a SKU can sell fast and still be a lousy place to invest your next inventory dollar.
An obviously unprofitable product gets attention.
Eventually.
The trickier product is the one that is still profitable enough to look healthy.
Imagine a SKU whose margin falls:
There is no giant red siren.
Orders keep arriving.
Revenue looks fine.
Sales meetings remain pleasantly non-apocalyptic.
But over thousands of units, that margin erosion may represent tens of thousands of dollars disappearing from the business.
Profit problems usually don’t kick down the door.
They nibble.
A little more fulfillment cost.
A little more advertising.
A slightly higher return rate.
A surcharge.
Some extra storage.
Then suddenly you look at your P&L and wonder who has been eating your margin.
Spoiler: everyone brought a fork.
This is where manually checking Amazon fees becomes increasingly difficult.
The goal isn’t merely to discover:
“Amazon charged us $X this month.”
The better questions are:
That’s where SKU-level economics become much more useful than a monthly total.
Amazon gives sellers plenty of data.
The challenge is turning it into something you can actually act on before another month disappears.
SellerPulse from eComEngine helps you review profitability at the SKU level and see the numbers and trends affecting your margins.
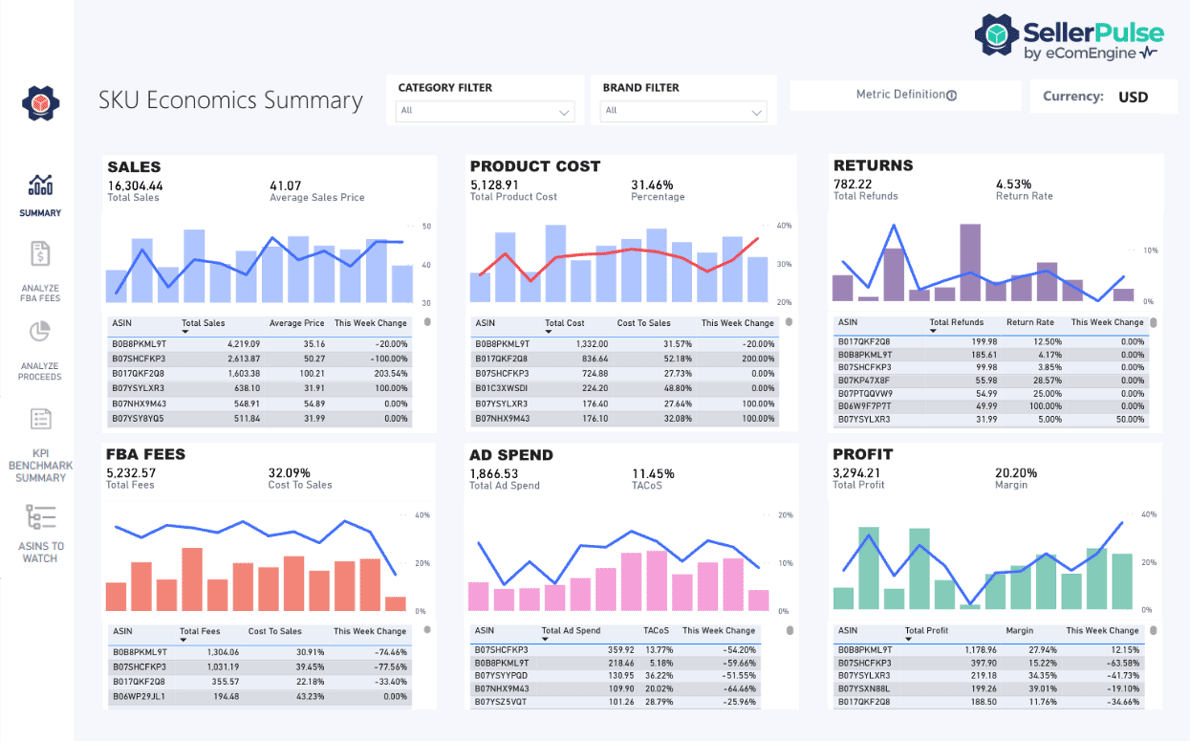
Its SKU Economics reporting brings together metrics including sales, product costs, returns, FBA fees, ad spend, and profits, while its FBA fee analysis lets you review fees by product, fee type, and week.
That means instead of simply knowing that Amazon fees went up, you can investigate where the increase is hitting your business hardest.
SellerPulse can help you:
Because Amazon changing a fee isn’t necessarily the emergency.
Not knowing what that fee change did to your products is.
Amazon’s fees changed.
Your costs probably changed.
Your advertising changed.
Your return rates may have changed.
Your margin should probably get the memo.
You don’t need to spend the weekend interrogating every ASIN in your catalog like it knows where the missing margin went.
Prioritize.
Start with:
Pennies multiply fastest here.
They have the least room for fee increases.
Look for large fulfillment charges and products where dimensions or weight create additional cost exposure.
Returns can dramatically alter what looked like attractive topline economics.
Before committing substantial cash, confirm that today’s economics still justify tomorrow’s inventory investment.
If you’re planning to discount a product for Q4, calculate margin using the promotional price, not the price you wish customers were going to pay.
Amazon fee changes aren’t going away.
Some will be annual adjustments.
Some may be temporary surcharges.
Others will come from the normal mechanics of FBA; storage, returns, inventory age, fulfillment tiers, and everything else that makes Amazon accounting such a delightful little hobby.
You can’t control every fee Amazon changes.
You can control whether those changes catch you by surprise.
Before Q4 pricing locks in, recalculate the economics of the SKUs that matter most.
Find the products whose margins are holding.
Find the ones quietly slipping.
And make your next pricing, advertising, and inventory decision based on what is actually profitable now.
Not what was profitable six months ago.
Because revenue is exciting.
Profit is what you get to keep.
Q: What changed with Amazon FBA fees in 2026?
Amazon announced that U.S. FBA fees would increase by an average of approximately $0.08 per unit in 2026, with most changes taking effect January 15. Amazon later added a 3.5% fuel and logistics-related surcharge to FBA fulfillment fees beginning April 17, 2026.
Q: How does Amazon’s 3.5% fuel and logistics surcharge work?
Amazon’s 3.5% fuel and logistics surcharge is calculated on the applicable FBA fulfillment fee, not on the product’s selling price. Amazon says the surcharge averages approximately $0.17 per unit for U.S. FBA, although the actual charge varies by product.
Q: How much does Amazon’s 2026 fuel surcharge cost per unit?
Amazon estimates the 3.5% fuel and logistics surcharge costs approximately $0.17 per U.S. FBA unit on average. For example, a $5.00 FBA fulfillment fee would generate a surcharge of approximately $0.18.
Q: What are Amazon FBA storage fees during Q4 2026?
For standard-size, non-dangerous goods, Amazon’s 2026 base monthly storage rate is approximately $0.78 per cubic foot from January through September and $2.40 from October through December. Oversize inventory generally moves from $0.56 to $1.40 per cubic foot during the same periods, before any applicable additional storage surcharges.
Q: How do I calculate my true Amazon FBA profit margin?
Calculate true FBA profit by subtracting product cost, referral fees, fulfillment fees, the fuel and logistics surcharge, storage, advertising, refunds, returns, inbound costs, and other variable expenses from sales. Divide the resulting profit by sales to calculate your true profit margin percentage.
Q: Should I raise my Amazon prices because FBA fees increased?
Not necessarily. Sellers should first calculate the fee increase and true margin for each SKU, then consider price elasticity, competition, conversion rates, advertising efficiency, and profitability before changing prices. A price increase that protects margin but damages conversion can create a different profitability problem.
Q: How can SellerPulse help me track Amazon FBA fees and profitability?
SellerPulse provides SKU-level economics that include sales, product costs, returns, FBA fees, ad spend, and profit metrics. Its FBA fee reporting also allows sellers to analyze charges by product, fee type, and week so they can identify where margin pressure is developing.
The price that worked in January doesn’t automatically work in September.
Before you commit more inventory dollars, increase ad spend, or lock in Q4 promotions, make sure you know what each important SKU is actually earning after today’s Amazon fees.
See where fees are rising, where margin is slipping, and which products are still earning their place in your catalog.
Recalculate Your True Margin








No Comments Yet
Let us know what you think