
Originally published on April 27, 2017, updated July 31, 2023
Menu
Join Our Email List
- Receive our monthly newsletter.
- Stay up to date on Amazon policies.
- Get tips to grow your business.
/%5BeComEngine%5DLogo-2019-linear.svg "eComEngine Logo")
| Review Monitoring Quickly identify review trends |
| Review Monitoring Quickly identify review trends |

All sellers need to know how their products are performing on the Amazon marketplace. If you're a brand owner or private label merchant, this information is doubly important.
Why?
Product reviews can provide essential information about how a brand is performing and areas for potential improvement to leverage your success. However, analyzing this data can be time-consuming. But luckily for you, that's where FeedbackFive shines!
In this post, we'll explore the software's Amazon review analytics feature (a seller favorite!) and see examples of what you can do with all that valuable data.
FeedbackFive's Product Review dashboard provides Amazon review analytics for sellers in an easily accessible and intuitive format. This feature is available to any FeedbackFive user that has added an ASIN for product review management.
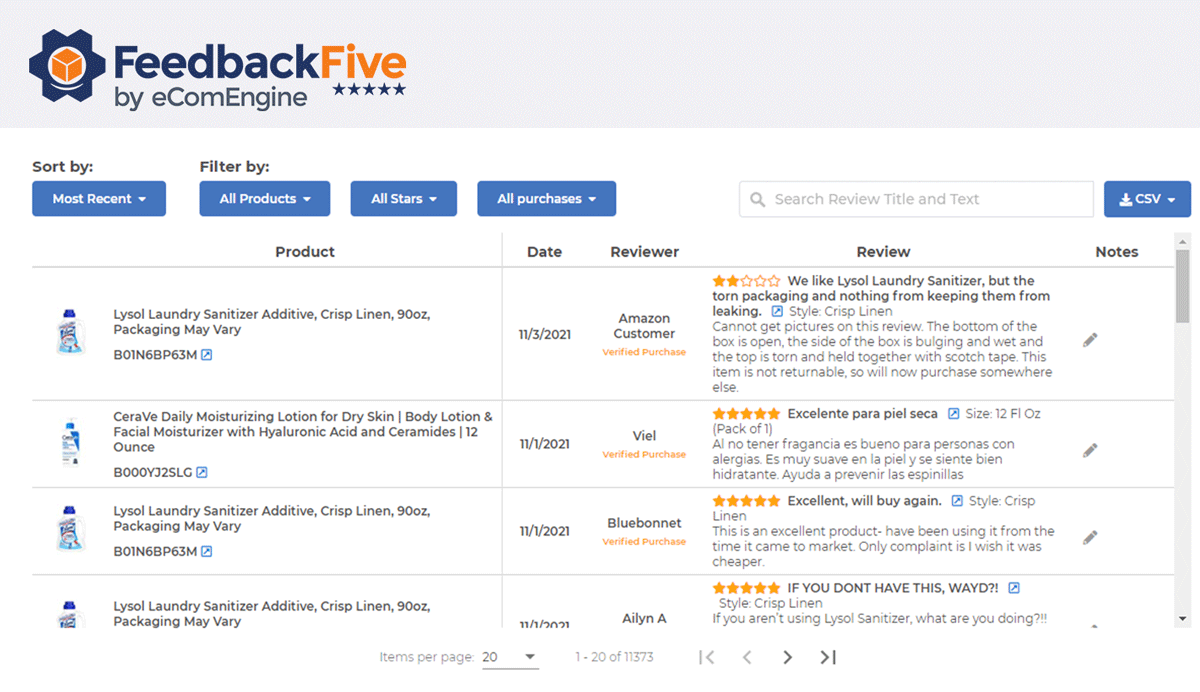
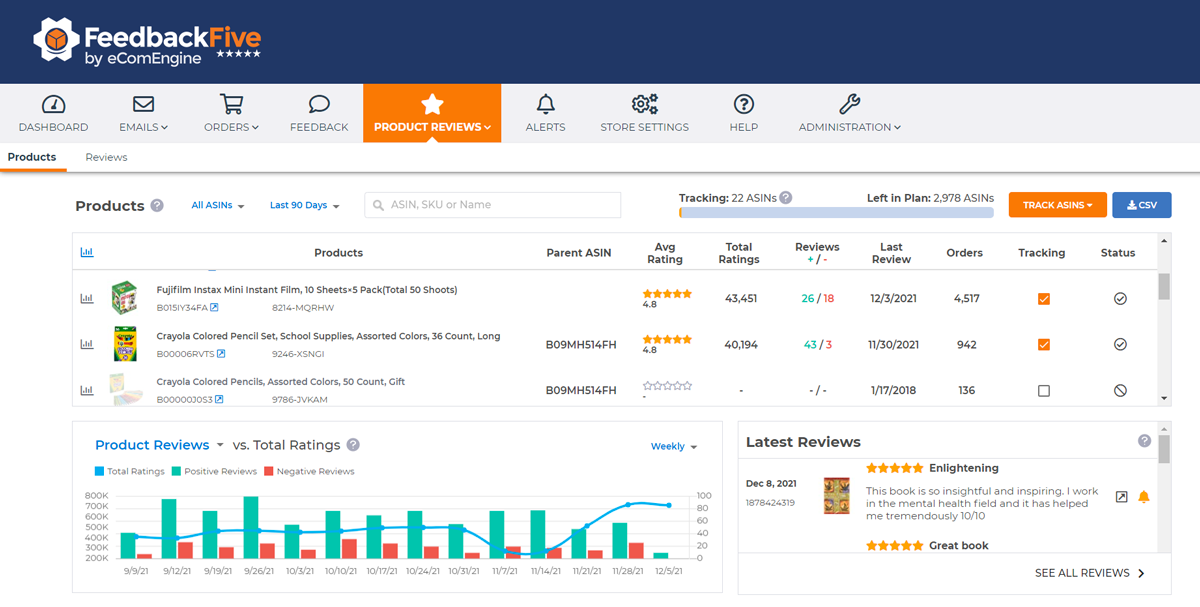
To access the charts, simply log in and find FeedbackFive's Product Reviews pages. The Products page shows you an overview of all product review features and allows you to control which ASINs you're currently tracking. Over on the Reviews page, you'll see reviews for all of the items you're tracking and be able to view more analytics and make notes.
Once you're in the right place, here are some of the key things that you can do with this incredibly valuable information.
Are you struggling with a problematic ASIN? Want a closer look at your product review ratings over time? The Products page can help.
Detailed information about the items in your catalog is shown on the Products Table, including the average rating for each product. Toggle between 7, 30, 60, and 90 day views to see how a product has performed within the designated time period.
If you’re not sure whether or not you want to restock a particular item, checking your Amazon review analytics to see the average rating can give you some perspective. Maybe the product was receiving low reviews due to inbound shipping damage, but it started getting positive reviews when you changed the shipping prep process. In that case, it may be worth keeping it in your inventory. But if a product started with great reviews that declined over time (perhaps due to a change in market preferences or technology), you may want to think twice before stocking it again.
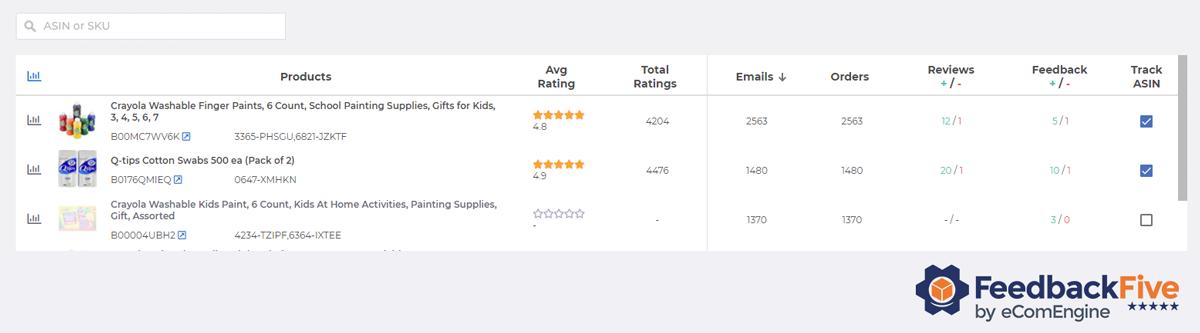
If you want to drill down further, you can see the number of one-tap ratings and written reviews your product has received in the Campaign Analytics graph (found on the Analytics page under Emails). Just below the graph, the Product Metrics Table offers an overview of how each ASIN is performing, from average rating to orders received.
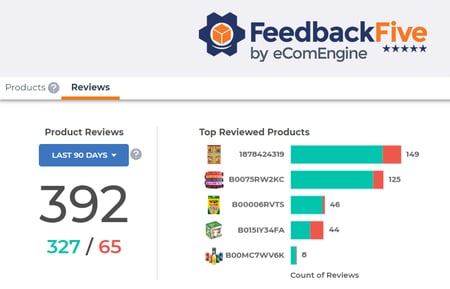
For a quick audit of how well your Amazon review strategy is working, visit the Reviews page and check the simple but highly impactful visuals. You'll see how many total reviews you've gained in the selected time frame along with your top reviewed products and the number of new product reviews. Get all the information you need at a glance!
Tracking product reviews over time is a smart way to make sure each item in your store is performing successfully, but there’s no need to delve into this data manually. FeedbackFive makes it easy to see your Amazon review analytics in just a few simple clicks!
If you’re interested in learning how to get Amazon reviews, check out our free guide. FeedbackFive has all of the tools you need to request, monitor, and analyze customer reviews.


No Comments Yet
Let us know what you think