Overview
Managing your Amazon inventory efficiently is one of the most important drivers of profitability. With the new Inventory KPI features in SellerPulse, you can now track and benchmark the top 3 inventory metrics that impact your margins, cash flow, and Amazon account health:
- Days of Supply
- Sell-Through Rate (90-day)
- Aged Inventory % (>90 days)
These KPIs are benchmarked against default or customized standards and surfaced in SellerPulse reports so you can take quick, confident action.
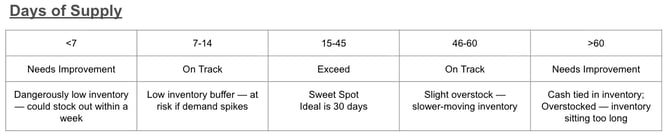
Days of Supply
What it means:
Days of Supply shows how long your current inventory will last, based on actual sales velocity. It is the #1 indicator of how efficiently your capital is being used.
Inventory Units On Hand ÷ Average Daily Sales
Why it matters:
- Too low = risk of stockouts, lost sales, and lower search rank.
- Too high = cash tied up in inventory that isn’t moving.
Actions you can take in SellerPulse:
- Defer reorders for slow movers
- Increase marketing/ad spend on high-velocity, low-stock SKUs
- Reprice or liquidate excess inventory
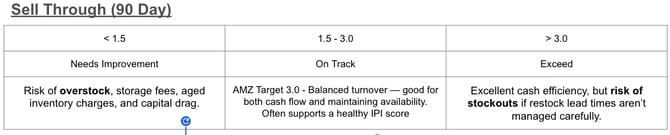
Sell-Through Rate (90-Day)
What it means:
Sell-Through Rate measures how quickly your inventory is being sold and shipped. It’s directly tied to Amazon’s Inventory Performance Index (IPI) score, which impacts your storage limits.
Units Shipped (90 days) ÷ Avg Units Available (90 days)
Why it matters:
- Higher STR means inventory is moving efficiently.
- Lower STR signals overstock, stale listings, or weak demand.
Actions you can take in SellerPulse:
- Run promotions or bundles for slow-moving SKUs
- Improve product listings (titles, images, reviews)
- Identify SKUs where supply is misaligned with demand
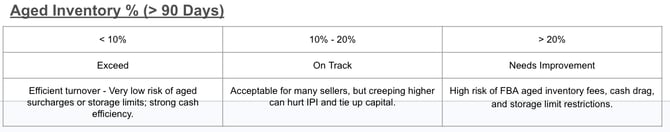
Aged Inventory % (>90 Days)
What it means:
Aged Inventory measures what percentage of your inventory has been sitting in Amazon fulfillment centers for 90+ days. Older inventory ties up capital and risks long-term storage fees (LTSF). Amazon’s aged inventory calculation is based on the number of days an individual unit has been stored in a fulfillment center, starting from the earliest received date of that unit.
Units in FBA >90 days ÷ Total Units in FBA
Why it matters:
- Aged stock = higher storage fees + weaker cash flow.
- Amazon penalizes stale inventory in IPI scoring.
Actions you can take in SellerPulse:
- Run clearance or liquidation campaigns
- Stop restocking low-performing SKUs
- Diagnose why products aren’t moving (price, PPC, reviews)
Why These 3 KPIs?
Together, these metrics give you a clear picture of inventory health:
- Cash Efficiency: Days of Supply
- Sales Velocity: Sell-Through Rate
- Storage Risk: Aged Inventory %
By monitoring them weekly, you can make small but high-impact adjustments that protect your margins.
How SellerPulse Helps You Stay on Top
SellerPulse doesn’t just show you the numbers — it makes them actionable:
Step 1 - Benchmark Performance
Every KPI is compared against default or customized benchmarks so you immediately see what’s “healthy” versus what needs attention.Step 2 - Surface Key ASINs
SellerPulse highlights the Top 10 SKUs that need improvement for each KPI, so you know exactly where to focus.
- Top 10 Days of Supply issues
- Top 10 Sell-Through (90-day) issues
- Top 10 Aged Inventory % issues
Step 3 - Provide Detail to Respond with Intent
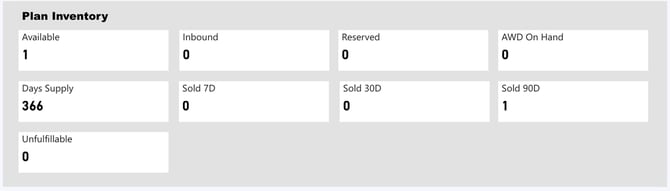
For each flagged SKU, you’ll see detailed data from the Plan Inventory Report, including:
- Inventory planning data
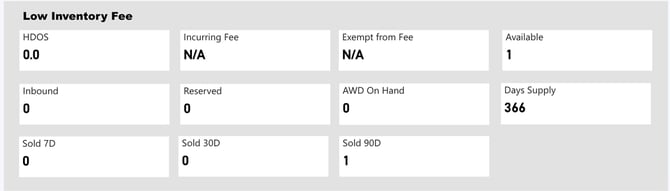
- Low inventory fee exposure
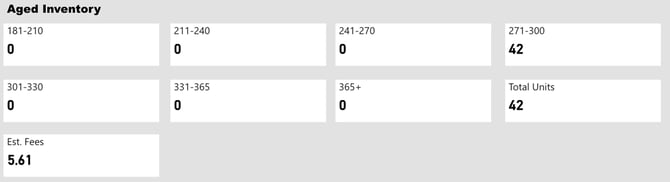
- Aged inventory surcharge risk
- 12-week trend view
Reports and Alerts
Inventory KPI Benchmark Report
Located in the Inventory Planning Report, this weekly summary compares your inventory metrics to default or customized standards. This report provides a Quick Health Check where sellers can see at a glance whether KPIs are exceeding, on track, or need improvement.
- 12-Week Inventory Scorecard: Displays a 12 week rolling average of your key KPI.
- Weekly Benchmark Trend: SellerPulse displays 12 weeks of weekly KPI snapshots, allowing you to monitor changes and trends across each week of the reporting period.
- Note: Data collection begins at the time of onboarding or trial activation. Historical data is not retroactively available, but SellerPulse will begin capturing and storing KPI data from that point forward, building your dataset over time..

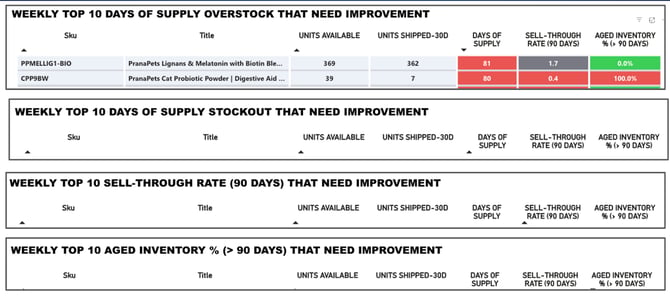
Inventory SKUs to Watch
Also located in the Inventory Planning Report, this report highlights the top 10 SKUs that need attention for each of the key inventory KPI. This helps sellers focus on the SKUs that will have the most impact on cash flow and storage costs.
- Top 10 Days of Supply That Need Improvement - Overstock and Stockout Risks
- Top 10 Sell-Through Rate That Need Improvement
- Top 10 Aged Inventory % That Need Improvement
Drill Through Report - Inventory SKU Detail
For deeper insights, sellers can drill into Inventory SKU Detail Reports. Once you have identified a particular SKU that you want to investigate, SellerPulse provides the SKU Detail Report. Right click on a specific SKU, select “Drill through”, then select SKU Details. This pulls data from the SellerPulse Plan Inventory Report and includes:
- Current inventory planning data
- Exposure to low inventory fees
- Aged inventory surcharge risks
- 12-week performance trends
- AWD Onhand, the total onhand quantity of units in the Amazon AWD distribution centers.
Weekly Email Alerts
Each week, you’ll receive a summary email that includes:
- The core elements of the Inventory planning report
- Inventory Summary Report
- Plan Inventory Report
- Low Inventory Fee Report
- Aged Inventory Surcharge Report
- Plus
- Inventory KPI Benchmark Report
- Top 10 Days of Supply SKUs that need improvement
- Top 10 Sell-Through SKUs that need improvement
- Top 10 Aged Inventory % SKUs that need improvement
Inventory KPI Data Collection in SellerPulse
- Data Collection Frequency
SellerPulse captures a snapshot of your inventory KPI data once per week, on a regular schedule. - 12-Week Scorecard
SellerPulse calculates and displays a rolling 12-week average for key inventory metrics, helping you identify trends over time. - Weekly Summary Reports
SellerPulse displays 12 weeks of weekly KPI snapshots, allowing you to monitor changes and trends across each week of the reporting period.. - Important Note on Data History
Data collection begins at the time of onboarding or trial activation. Historical data is not retroactively available, but SellerPulse will begin capturing and storing KPI data from that point forward, building your dataset over time.
Inventory KPI Default Benchmarks
Every seller is different, so SellerPulse lets you customize benchmark settings to fit your business.
See: KPI Benchmark Settings: Default vs. Custom
Inventory KPI default ranges are: