Turn (or inventory turnover) is the number of times your inventory rotates through the Amazon Fulfillment Center in a given time period. That is, it shows how often you sell off and completely replace your inventory.
A high inventory turn ratio means units are selling quickly, and a low one means that units are staying in the Amazon warehouse for a long time.
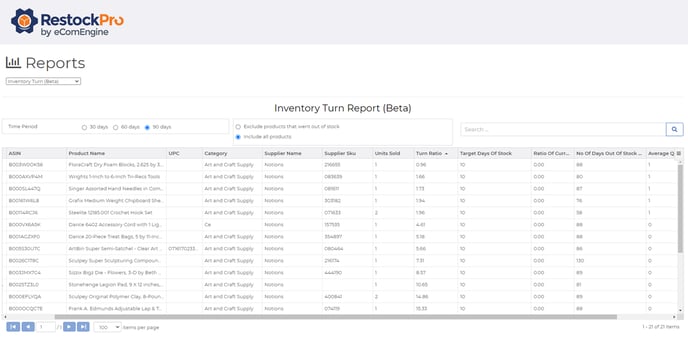
You can find this report in the Reports section of the Dashboard.
How does this report help me?
Use the data to see whether you are stocking products efficiently, or whether you should take action to avoid either going out of stock or incurring long-term storage fees.
- For products with a high turn ratio, examine their out of stock history:
- If they have frequently been out of stock, you are losing sales. Consider stocking these more heavily.
- If they have not been out of stock, you are restocking these products efficiently.
- For products with a low turn ratio, consider whether you are holding too much stock:
- If there is still demand for this type of product, but sales are slow, consider reducing the price or increasing advertising to make more sales.
- If there is very low demand for this type of product or other efforts have not worked, consider removing the item from Amazon to avoid potential long-term storage fees.
Report Criteria
Time Period: choose 30, 60, or 90 days.
Exclude products that went out of stock or include all products: choose whether you want to see your entire catalog, or only items that stayed in stock. (You should check products that went out of stock regularly to see if you could be selling more. However, if you have items you purposely allow to go out of stock, you may prefer to exclude them.)
Search bar: search items in the grid by title, SKU, category, supplier, etc.
Grid Options
Click the header of each column to sort by that column.
Click the hamburger icon on the upper right corner of the grid to show or hide columns or to access CSV export options.
Grid Columns
SKU, ASIN, Product Name, Product ID, UPC, EAN: basic information to identify the product
Category: Amazon category for this item
Supplier Name, Supplier SKU: information related to the supplier of this product
Units Sold: the number of units sold on Amazon in the time period selected at the top of the report
Turn Ratio: the number of times your entire stock of this item at Amazon FBA was sold through and replaced in the selected time period
Current Day Stock Remaining: the number of days' worth of this item you currently have at Amazon
Target Days of Stock: the target Quantity on Hand, or number of days' worth of this item you want to have at Amazon (set this for your whole store on the Restock Rules page or on the item's supplier)
Ratio of Current to Target: the Current Day Stock Remaining divided by the Target Days of Stock (ideally, this should be close to 1.00)
No of Days Out of Stock: the number of days in the selected time period that this item was out of stock at Amazon
Average QOH: the average number of units you had as quantity on hand at Amazon during the selected time period
EM: estimated margin, as a currency value (based on the costs you input for this product on the Products page, Amazon fees, and sales price)
Inventory Value: the currency value of the inventory you currently have on hand at Amazon