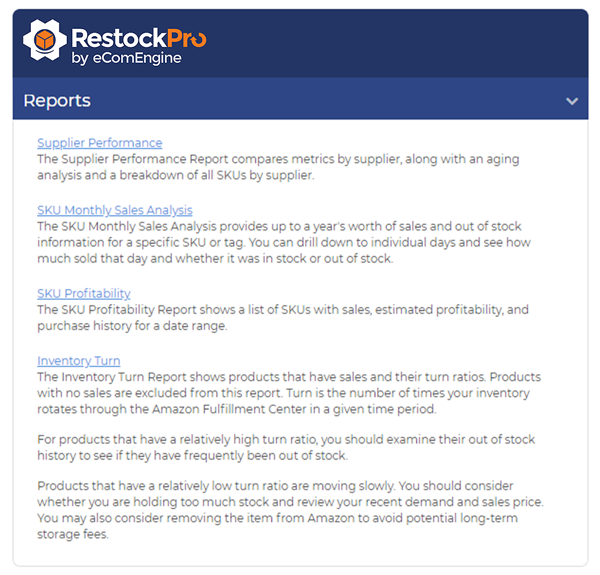
You can find this report in the Reports section of the Dashboard.

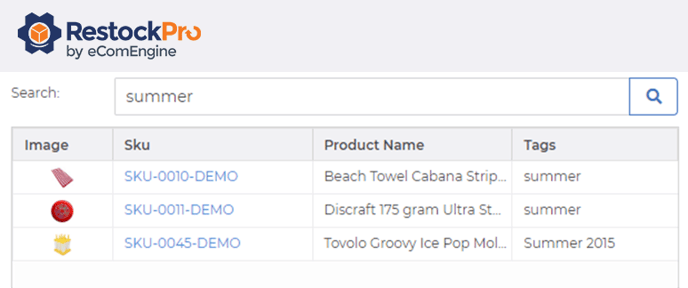
On the left, you will see a list of all your SKUs, with an image, the SKU number, product name, and any tags you’ve applied to the products. You can also search for a particular SKU by any of those fields.
Click on a SKU to see its Inventory/Sales Chart and Monthly Analysis. The Inventory/Sales Chart allows you to choose a date range (last 7, 30, 60, or 90 days, 6 months, 1 Year, or Custom). The graph shows you the percentage of the time that the item was in stock plus how many units were sold during the selected date range.
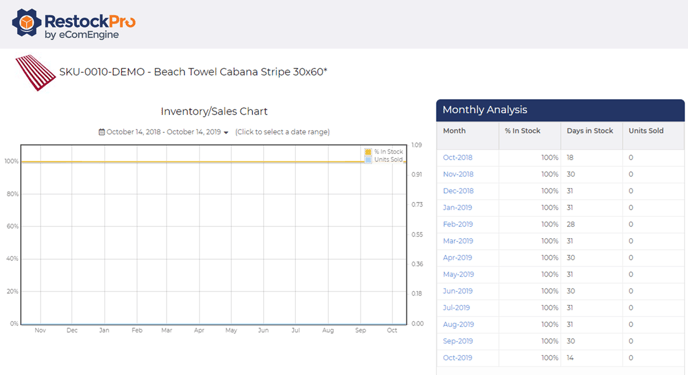
The Monthly Analysis shows the in stock percentage, number of days in stock, and units sold broken down by each month for the past year. Click a month to see the in stock days and units sold broken down by each day within that month.
How does this report help me?
Use the SKU Monthly Sales Analysis to understand when your items ran out of stock, which of your products could have sold more if they had not gone out of stock, and which items sell more or less during certain seasons. This data helps you know whether you may need to round your reorder quantities up or down, watch or ignore certain items on the Restock Suggestions page during particular seasons, and more.