
Instead of reviewing multiple reports or searching through large amounts of data, the dashboard answers three practical questions:
- What changed?
- What is outside its expected range?
- What should I investigate this week?
Use the dashboard at the beginning of each week to review overall performance, identify profit leaks, improve inventory efficiency, and focus on the SKUs that need attention most.
Performance Snapshot
The Performance Snapshot provides a high-level view of the financial direction of your business. It includes three metrics calculated using 12-week averages from the KPI Benchmark Report:
- Weekly Sales Velocity: Your average weekly sales over the past 12 weeks.
- Weekly Profit Velocity: Your average weekly profit over the past 12 weeks.
- Profit Margin: Your average profit as a percentage of sales over the past 12 weeks.
Together, these metrics help you determine whether your business is generating consistent sales and whether those sales are producing sufficient profit.
For example, sales may be increasing while profit velocity or profit margin is declining. That could indicate rising Amazon fees, higher advertising costs, increased product costs, or another profitability issue that requires investigation.
Profit Leaks
The Profit Leaks section identifies cost-related KPIs that exceed their acceptable benchmark ranges and estimates their potential financial impact.
Profit Leak is calculated for:
- Amazon FBA Fees %
- TACoS %
- Product Cost %
- Returns %
For each KPI, SellerPulse compares the actual percentage with the upper boundary of its acceptable benchmark range. When the actual value exceeds that boundary, SellerPulse multiplies the excess percentage by sales:
Estimated Profit Leak = (Actual KPI % − Upper Benchmark %) × Sales
If the KPI is within or below its acceptable range, the estimated Profit Leak is $0.
The calculation measures only the potential improvement from returning the KPI to the upper boundary of the acceptable range. It does not assume that the KPI can reach the midpoint or lower boundary of the range.
Dashboard Profit Leak values use 12-week metrics and are sorted from highest to lowest estimated dollar impact. This helps you distinguish between a KPI that is outside its range and one that may have a significant financial impact.
Profit Leak is currently calculated as follows:
- FBA Fees: Estimated impact of FBA Fee % above its acceptable range.
- TACoS: Estimated impact of advertising costs above the acceptable TACoS range. This assumes advertising efficiency could improve without an equivalent reduction in sales.
- Product Cost: Estimated impact of Product Cost % above its acceptable range. A high Product Cost % may reflect pricing, sourcing, freight, packaging, or other product economics—not only supplier cost.
- Returns: Value of returned sales above the acceptable Returns % range. SellerPulse calculates Returns % as Units Refunded divided by Units Ordered.
Select a Profit Leak to open the SKU Economics – KPI Benchmark Report, where you can review the supporting data and investigate the factors contributing to the issue.
Profit Leak values are estimates intended to help prioritize investigation. They do not represent guaranteed profit improvements.
Cash Efficiency
The Cash Efficiency section highlights inventory KPIs that are outside their benchmark ranges.
These issues may indicate that inventory is:
- Selling more slowly than expected
- At risk of stocking out
- Overstocked
- Aging in Amazon fulfillment centers
- Tying up more cash than necessary
Select an issue to open the Inventory – KPI Benchmark Report and review the related inventory performance in greater detail.
The goal is to balance product availability with efficient use of working capital. Too little inventory can lead to lost sales, while too much inventory can increase storage costs and leave cash tied up in slow-moving products.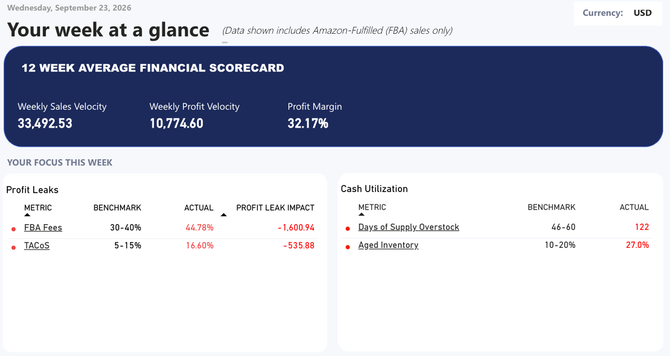
Profit Leak SKUs to Watch
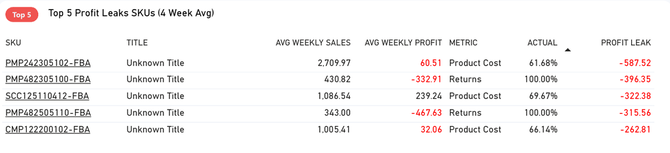
The Profit Leak SKUs to Watch This Week section identifies up to five SKUs with the highest estimated Profit Leak.
Unlike a list based only on profit margin or total profit, this section prioritizes SKUs according to the estimated dollar impact of KPI performance above its acceptable range.
SKUs are sorted from highest to lowest estimated Profit Leak so you can focus first on the issues with the greatest potential financial impact.
Select a SKU to open the SKU Economics – SKUs to Watch Report and investigate its performance in greater detail. Possible actions may include reviewing pricing, advertising efficiency, FBA fees, product costs, return activity, or other product
Low Profit SKUs to Watch
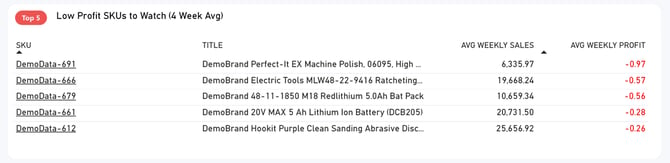
The Low Profit SKUs to Watch This Week section identifies up to five of your least-profitable SKUs that are currently outside their expected ranges.
This list helps you move from an account-level profitability issue to the individual products having the greatest negative impact.
A SKU may appear in this section because of factors such as:
- Low or negative profit
- Declining profit margin
- High Amazon FBA fees
- High TACoS advertising costs
- Increased refunds or returns
- Product costs that are too high relative to selling price
Select a SKU to open the SKU Economics – SKUs to Watch Report and investigate its performance in greater detail.
Possible actions may include reviewing pricing, advertising efficiency, product costs, fees, return activity, or whether the SKU should remain part of your product portfolio.
Days of Supply SKUs to Watch
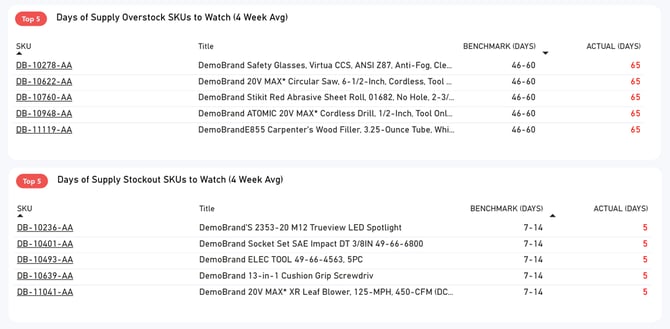
The Days of Supply SKUs to Watch section focuses on products with the most significant Days of Supply issues. It includes two lists.
Overstock SKUs
This list identifies up to five SKUs with the highest Days of Supply that are outside their expected ranges.
These products may be tying up cash, generating storage costs, or becoming vulnerable to aged-inventory fees. Consider whether you should reduce replenishment, adjust pricing, increase promotional activity, or take another action to improve sell-through.
Stockout SKUs
This list identifies up to five SKUs with the lowest Days of Supply that are outside their expected ranges.
These products may be at risk of running out of inventory before additional units are available. Consider current sales velocity, available inventory, inbound shipments, supplier lead times, and the appropriate reorder timing.
Select a SKU from either list to open the Inventory – SKUs to Watch Report for additional detail.
A Suggested Monday Morning Workflow
SellerPulse is designed to help you establish a consistent weekly operating habit. At the beginning of each week:
- Review the Performance Snapshot.
Determine whether sales, profit, and profit margin are moving in the right direction. - Check for Profit Leaks.
Identify which financial KPIs are outside their benchmark ranges. - Review Cash Efficiency.
Look for inventory conditions that may be tying up cash or creating stockout risk. - Investigate the SKUs to Watch.
Focus first on the least-profitable, most overstocked, and most at-risk products. - Assign the appropriate actions.
Decide which pricing, advertising, purchasing, inventory, or operational changes should be addressed during the week.
The dashboard is intended to prioritize your review—not replace the underlying SellerPulse reports. Use the links within each section to investigate the data, understand the cause of an issue, and determine the appropriate action.
By following the same workflow each week, you can spend less time searching through reports and more time addressing the issues that have the greatest impact on profitability and cash flow.