Overview
The KPI Benchmark Summary and ASINs to Watch reports are designed to help you monitor key financial performance indicators (KPIs) against benchmarks, enabling you to identify high-performing ASINs to scale and underperforming ones to fix, reposition, or retire. These tools give you the visibility to stop profit leaks and fuel growth with data-driven confidence.
Purpose of the KPI Benchmark Report
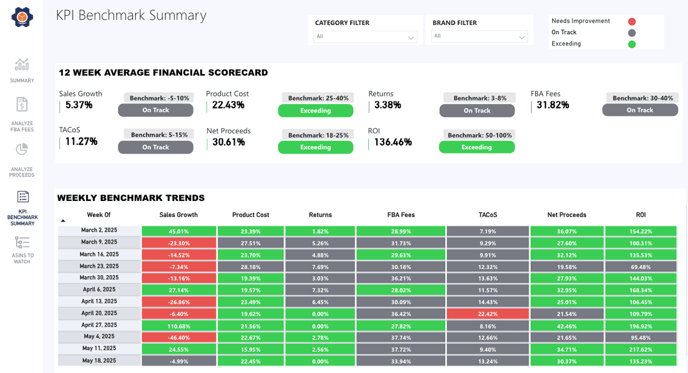
Quickly assess your overall business health by comparing your core financial KPIs against industry-accepted or custom-set benchmarks. View both aggregate and weekly trends over a rolling 12-week period.
Key Features
- 12-Week Average Financial KPI View
Track aggregate KPI performance for the last 12 weeks. - Weekly Financial KPI View
Track KPI performance for each of the last 12 weeks. - Benchmark Ratings
Visual indicators help you instantly gauge performance as compared to the benchmark criteria defined in the SellerPulse Settings :

-
- Sales Growth - Sales Growth (week over week) - the percentage change in product sales over the previous week.
- Product Cost (% of Sales) = Total product cost as a percentage of sales. (uploaded in SellerPulse Settings)
- Return Rate = Returns as a percentage of sales (Units Returned / Units Sold)
- FBA Fees (% of Sales) = the proportion of a product's FBA fees to its total sales (Total Fees / Total Sales). This metric shows how much of your sales is consumed by FBA Fees.
- TACoS (% of Sales) = total advertising cost of sale (Total Ad Spend / Total Sales). TACoS provides insight into how advertising impacts overall sales performance, including organic sales.
- Profit (% of Sales) = Profit as a percentage of sales where Profit is the total proceeds for each product after accounting for Product Costs, Refunds, FBA Fees, and Ad Spend (Profit = Sales - Product Costs - Refunds - FBA Fees - Ad Spend).
- ROI = Profit / Product Cost
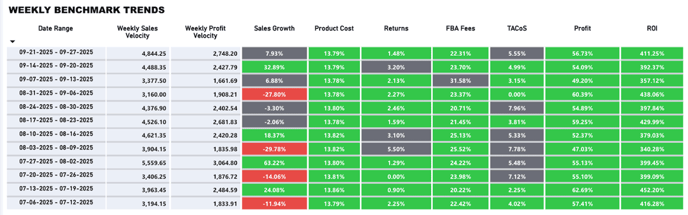
- Weekly Sales Velocity - Average weekly sales over the last 12 weeks.
- Weekly Net Proceeds Velocity - Average weekly net proceeds over the last 12 weeks
- Sales Growth - Sales Growth (week over week) - the percentage change in product sales over the previous week.
- Filters
- Category and Brand filters (same as in SKU Economics reports)
ASINs to Watch Report
Purpose
Identify your most and least profitable ASINs weekly to quickly decide where to double down or where to take corrective action.

Key Features
- Top 10 Profitable ASINs (4-Week Avg)
Highlights the most profitable ASINs of the week. - Top 10 Low-Profit ASINs (4-Week Avg)
Flags the least profitable ASINs — ideal for review or troubleshooting. - FBA Fee Watchlist: Top 10 ASINs Needing Attention (4-Week Avg)
List the top 10 ASINs sorted from highest % FBA fees to lowest for the top 10 - Returns Watchlist: Top 10 ASINs Needing Attention (4-Week Avg)
List the top 10 ASINs sorted from highest % Returns to lowest for the top 10 - TACoS Watchlist: Top 10 ASINs Needing Attention (4-Week Avg)
List the top 10 ASINs sorted from highest % TACoS to lowest for the top 10
Usability Notes
- Currency Indicator at the top of the report
- Product Cost Upload Status = User can upload product cost data to the SKU Economics report via the SellerPulse Settings tab. Since product costs have significant impact on the financial data, the SKU Economics report will provide a status of product cost data.
- Latest upload date: Product cost last updated on MM/DD/YYY.
- Percentage of ASINs with product cost data: xx% of ASINs have a product cost.
Last Updated Timestamp
-
- Data is scheduled to be refreshed every Monday
- The data update covers the previous week: Sunday–Saturday
- Labeled by the “Week Starting” date
Example:
-
- Data updated on Mon, May 5
- Reflects data from Sun, Apr 27 – Sat, May 3
- Chart label = Week Starting Apr 27
- Data updated on Mon, May 5
Drill Through Report - ASIN Details
Purpose
Once you have identified a particular ASIN that you want to investigate, SellerPulse provides the ASIN Detail Report. Right click on a specific ASIN, select “Drill through”, then select ASIN Details

The ASIN details report provides additional data on the specific ASIN to help you adjustments, such as reallocating ad spend, adjusting pricing, modifying listings, or phasing out low-margin products.
Key Features
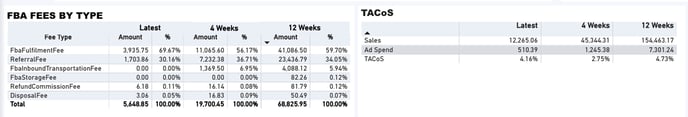
- FBA Fees by Type
- FBA fee by type for the week for the ASIN - what is happening this week?
- FBA fee by type for the 12 week for the ASIN - Are this week’s reasons an anomaly or consistent with the past?
- Weekly Benchmark Trends - What is my overall benchmark trend for this ASIN?
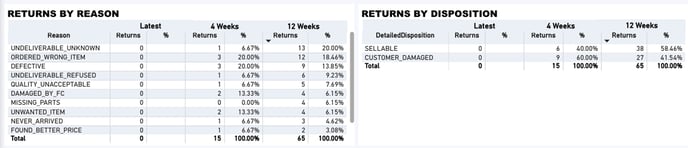
- Returns Reason and Disposition
- See the number of returns and the number of returns broken down by the condition in which the items were returned for the specific ASIN.
- See the number of returns and the number of returns broken down by the condition in which the items were returned for the specific ASIN.
- TACoS
- Weekly sales vs TACoS % - what is happening this week?
- Weekly TACos for the 12 weeks - Are this week’s reasons an anomaly or consistent with the past?
- Weekly Benchmark Trends
- What is my overall benchmark trend for the last 12 weeks for this ASIN?
Usability Notes
- You can save your custom benchmark values without applying them right away. Benchmark editing and activation are separate steps, giving you flexibility to test or revise without immediately impacting your reports.
- Changes are saved immediately and reflected across your reports once applied.
You can toggle between default and custom settings at any time.
Data Updates & Refresh Cycle
Both reports are powered by data from the SKU Economics Module, refreshed weekly.
- Update Schedule: Data is scheduled to be refreshed every Monday
- Data Coverage: The data update covers the previous week: Sunday–Saturday
- Date Labels: Data points are marked by the "Week Starting" date
-
- Example:
- Example:
- Data updated on Monday, May 5
- Reflects data from Sun, Apr 27 – Sat, May 3
- Chart label = Week Starting Apr 27