To access it, go to the Reports section on the left side of your Dashboard and click on Supplier Performance.
The Supplier Grid on the upper left shows a list of your suppliers with key information about the SKUs assigned to them:
- Supplier: Click on the supplier name to display all the SKUs assigned to the supplier in the SKUs grid.
- # SKUs: the number of SKUs assigned to that supplier. (Assign more SKUs by going to the Products page and editing the Supplier Alias.)
- # Units: the number of units you have on hand for that supplier.
- Total Cost: the cost of the units you have on hand from that supplier, i.e. the total quantity on hand (QOH) times the supplier cost.
- Average EM based on 30D Sales: Average Estimated Margin (EM) for all the products that have positive QOH.
- Restocks EM % based on 30D Sales: Average Estimated Margin for all products that have positive QOH and positive EM.
- Qty > 270, 91 -180D, Etc.: the number of units that have stayed at Amazon FBA without being sold for more than the specified number of days, e.g. 270. Click the gear icon on the grid to choose which number(s) of days you want to see.
- 30D Sales: the average number of sales per day for items from this supplier.
On the right is a the pie chart shows aging data (in days) across all suppliers. Click a supplier in the grid to see an analysis of their SKUs only.
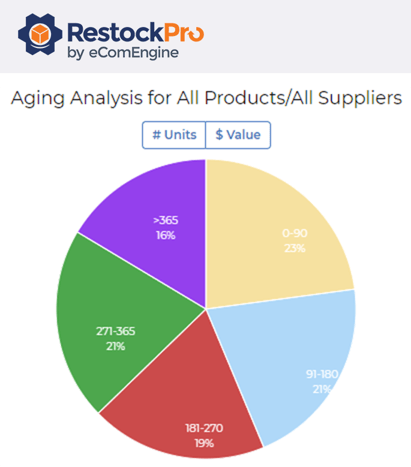
Once you click a supplier, the pie chart will show the aging categories for items from that supplier.
You will also see a breakdown of the SKUs in the SKUs Grid at the bottom, along with cost and velocity information, Amazon rank, Restock Needed quantity, and more. Click the gear icon to change the columns here as well.
You can download both the supplier grid and the SKUs grid as CSV files for further analysis.
Note: For accurate reporting, make sure all your supplier costs, rebates, etc. are set up correctly on the Suppliers page and Products page.
How does the Supplier Performance Report help me?
If you notice that SKUs from a particular supplier are aging longer than your other SKUs or have low sales velocity, this may mean that the items are experiencing issues or are poor quality, causing unhappy buyers to leave negative reviews and reduce sales. You may need to order samples from your supplier or have the manufacturer inspected to ensure that buyers are getting what they ordered. Or, you may choose to stop reordering from this supplier.
If you notice that SKUs from a certain supplier have a poor estimated margin, you may want to investigate whether you are taking advantage of all possible discounts from this supplier (e.g. rebates for ordering large amounts) and that your prices on Amazon are set appropriately.